This flow chart sample was drawn on the base on the illustration of the article "Climate change impact on China food security in 2050" from the website of Chinese Academy of Agricultural Sciences .
[caas.cn/ en/ newsroom/ research_ update/ 67347.shtml]
"Food security is a condition related to the ongoing availability of food. ...
According to the Food and Agriculture Organization (FAO), food security "exists when all people, at all times, have physical and economic access to sufficient, safe and nutritious food to meet their dietary needs and food preferences for an active and healthy life". ...
Extreme events, such as droughts and floods, are forecast to increase as climate change takes hold. Ranging from overnight floods to gradually worsening droughts, these will have a range of impacts on the agricultural sector. ...
According to the Climate & Development Knowledge Network report Managing Climate Extremes and Disasters in the Agriculture Sectors: Lessons from the IPCC SREX Report, the impacts will include changing productivity and livelihood patterns, economic losses, and impacts on infrastructure, markets and food security. Food security in future will be linked to our ability to adapt agricultural systems to extreme events." [Food security. Wikipedia]
The flowchart example "Food security assessment" was created using the ConceptDraw PRO diagramming and vector drawing software extended with the Flowcharts solution from the area "What is a Diagram" of ConceptDraw Solution Park.
Flowchart

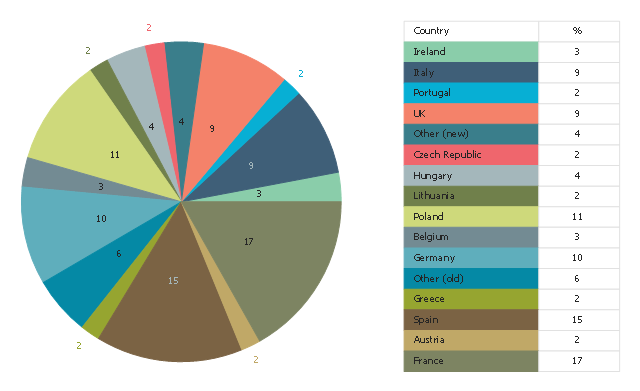
This pie chart sample shows the percentage of EU farm land by country. It was designed on the base of the Wikimedia Commons file: EUFarm-eng.svg. [commons.wikimedia.org/ wiki/ File:EUFarm-eng.svg]
"The agricultural sector is supported by subsidies from the European Union in the form of the Common Agricultural Policy (CAP). In 2013 this represented approximately €45billion (less than 33% of the overall budget of €148billion) of the EU's total spending. It was used originally to guarantee a minimum price for farmers in the EU. This is criticised as a form of protectionism, inhibiting trade, and damaging developing countries; one of the most vocal opponents is the UK, the second largest economy within the bloc, which has repeatedly refused to give up the annual UK rebate unless the CAP undergoes significant reform; France, the biggest beneficiary of the CAP and the bloc's third largest economy, is its most vocal proponent." [Economy of the European Union. Wikipedia]
The pie chart example "Percentage of EU farm land by country" was created using the ConceptDraw PRO diagramming and vector drawing software extended with the Pie Charts solutiton of the Graphs and Charts area in ConceptDraw Solution Park.
Pie chart
Bar Diagrams for Problem Solving. Create economics and financial bar charts with Bar Graphs Solution

The vector stencils library "Picture Graphs" contains 35 templates of picture bar graphs for visual data comparison and time series.
Drag a template from the library to your document, set bars number, type category labels, select bars and enter your data.
Use these shapes to draw your pictorial bar charts in the ConceptDraw PRO diagramming and vector drawing software.
The vector stencils library "Picture Graphs" is included in the Picture Graphs solution from the Graphs and Charts area of ConceptDraw Solution Park.
Arrow
Water drop

Food

Grain

Agriculture

Medicines

Houses

Buildings

Money bags

Oil barrels

Natural gas

Electrical power

Nuclear power

Mechanical engineering

Chemical industry

Mining

Gold bars

Coins

Person

Men, women and children

Man

Woman

Child

Milk

Meat

Fruits

Vegetables

Computer

Mobile phone

Airliner

Car

Bus

Truck

Train

Cargo ship

Example of DFD for Online Store (Data Flow Diagram)


Scatter Graph Charting Software

How to Draw Pictorial Chart. How to Use Infograms

Sample Pictorial Chart. Sample Infographics

Pictorial Chart

Bar Chart Template for Word

- Example Of Pie Diagram Related To Agriculture India
- Agricultural Pictorial Chart Images
- Area Charts | Pie Charts Of Agriculture In India
- Chart Related To Agriculture
- Pictorial Charts Related To Agriculture
- Draw The Chart Of Agriculture
- Bar Chart Of Agriculture Production In India
- Pictorial Chart Related To Agriculture
- Bar Diagram In Agriculture Examples
- Area Charts | Education Package | Bar Graph Of Indian Agriculture