Bar Diagrams for Problem Solving. Create space science bar charts with Bar Graphs Solution

This pie chart sample shows the atmosphere air composition. It was designed on the base of the Wikimedia Commons file: Air composition pie chart.JPG.
[commons.wikimedia.org/ wiki/ File:Air_ composition_ pie_ chart.JPG]
This file is licensed under the Creative Commons Attribution-Share Alike 3.0 Unported license. [creativecommons.org/ licenses/ by-sa/ 3.0/ deed.en]
"The atmosphere of Earth is a layer of gases surrounding the planet Earth that is retained by Earth's gravity. The atmosphere protects life on Earth by absorbing ultraviolet solar radiation, warming the surface through heat retention (greenhouse effect), and reducing temperature extremes between day and night (the diurnal temperature variation).
The common name given to the atmospheric gases used in breathing and photosynthesis is air. By volume, dry air contains 78.09% nitrogen, 20.95% oxygen, 0.93% argon, 0.039% carbon dioxide, and small amounts of other gases. Air also contains a variable amount of water vapor, on average around 1%. Although air content and atmospheric pressure vary at different layers, air suitable for the survival of terrestrial plants and terrestrial animals currently is only known to be found in Earth's troposphere and artificial atmospheres." [Atmosphere of Earth. Wikipedia]
The pie chart example "Atmosphere air composition" was created using the ConceptDraw PRO diagramming and vector drawing software extended with the Pie Charts solution of the Graphs and Charts area in ConceptDraw Solution Park.
Pie chart

Basic Diagramming Flowchart Software

Beautiful Nature Scene: Drawing
World Continents Map
Aerospace - Design Elements
Scientific Symbols Chart

Mathematics Solution from the Science and Education area of ConceptDraw Solution Park includes a few shape libraries of plane, solid geometric figures, trigonometrical functions and greek letters to help you create different professional looking mathematic illustrations for science and education.
Simple Drawing Applications for Mac

Biology Drawing Software

Sketching Software

Using Fishbone Diagrams for Problem Solving

Infographic Maker

Create Response Charts

Material Requisition Flowchart. Flowchart Examples

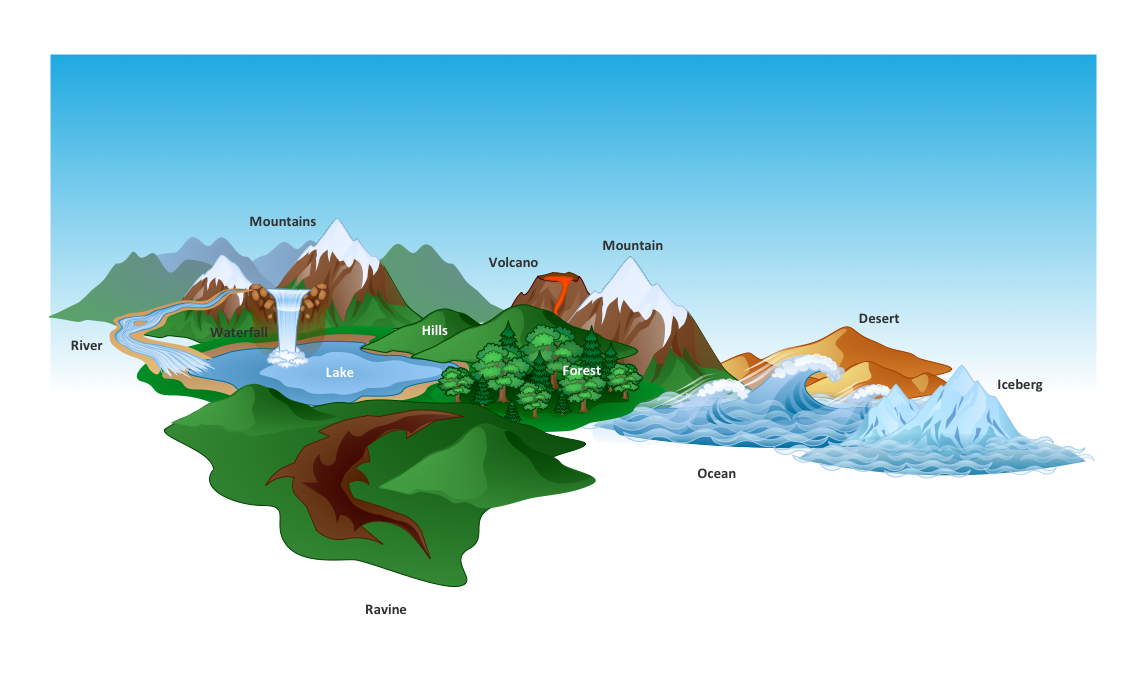
 Nature
This solution extends ConceptDraw DIAGRAM software with samples, templates and libraries of vector clipart for drawing the Nature illustrations. Use it to make professional-looking documents, presentations and websites illustrated with color scalable vector c
- Percentage Pie Chart . Pie Chart Examples | Atmosphere air ...
- Flow Chart For Earth Movement
- Drawing a Nature Scene | Nature | Water cycle diagram | Earth ...
- Drawing a Nature Scene | Nature | Flow Chart Of Earth Movement
- Water cycle diagram | Drawing a Nature Scene | Nature | Digram ...
- Simplified Diagram Of The Earth
- Diagram Of The Flow Chart Of Earth Movements
- Beautiful Nature Scene: Drawing | Flow Chart On Save The Earth
- Atmosphere air composition | Percentage Pie Chart . Pie Chart ...
- Earth Movement Flow Chart
- Pie Diagram On Percentage Of Water Available On Earth
- Simple Flow Chart | How to Draw Physics Diagrams in ConceptDraw ...
- Basic Diagramming Flowchart Software | Scientific Symbols Chart ...
- Atmosphere air composition | On Earth Air Gas Chart
- CERES data flow diagram | Process Flowchart | Bar Diagrams for ...
- Diagram Of Earth In Gas
- Gas Components Of Earth Pie Chart
- How to Draw a Pie Chart Using ConceptDraw PRO | Pie Chart ...
- Process Flowchart | A Chàrt About The Earth Movement
- Earth System Example Diagram