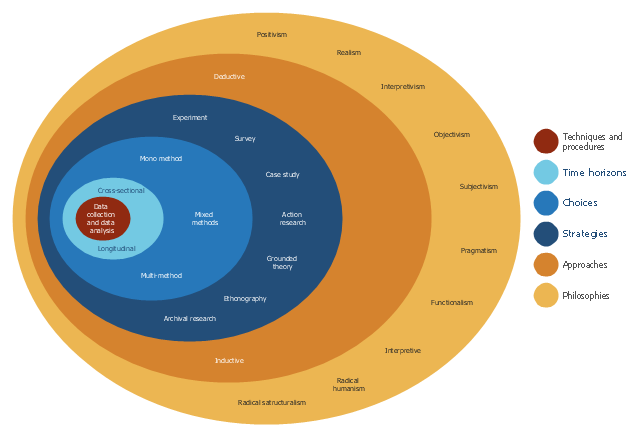
This onion diagram example was designed on the base of figure "Research onion" in the article "The research methodology for the development of a kaizen costing framework suitable for indigenous construction firms in Lagos, Nigeria." by T. Omotayo and U. Kulatunga from the Association of Researchers in Construction Management (ARCOM) website.
"The need for a cost management paradigm shift in the construction industry is imperative because of the prevailing challenges of managing construction cost during construction. Small and medium scale construction firms in Nigeria are faced with the challenges of competition from foreign firm, cost overrun, project delays and unsatisfied clients. This challenge may be handled with kaizen principles and kaizen costing. This paper utilized literatures related to research methodology in the built environment to create a research framework for the study. This focused on the research philosophical stands, approaches and strategy related to the built environment. The research onion model was adopted for the framework development and the sample size of two hundred and fifty (250) respondents was selected based on theoretical sampling for quantitative data collection using questionnaires." [arcom.ac.uk/ -docs/ workshops/ 2015-04_ Dublin-Proceedings.pdf]
The onion diagram example "Research onion diagram" was drawn using the ConceptDraw PRO software extended with the Stakeholder Onion Diagrams solution from the Management area of ConceptDraw Solution Park.
Onion diagram example
Using Fishbone Diagrams for Problem Solving

Business Process Modeling Software for Mac

Use a Fishbone Diagram to Attack Complex Problems

ConceptDraw PROJECT Project Management Software Tool

HelpDesk
How to Make a Logistic Dashboard

Processing Flow Chart

ConceptDraw PRO enhanced with Flowcharts Solution from the "What is a Diagram" Area of ConceptDraw Solution Park is a powerful Processing Flow Chart software which will help save lots of your time.
 Project Management Area
Project Management area provides Toolbox solutions to support solving issues related to planning, tracking, milestones, events, resource usage, and other typical project management functions.
Applications

Provide Team Training

Skype as eLearning Platform


How Teachers Use Skype for eLearning

- Challenges To Sustainable Development Wikipedia Com
- Sample Of Business Challenges Presentations
- Van Diagram With Social Challenges
- Design Principles And Challenges In Ad Hoc Wireless Networks
- Challenges Of Sustainable Development Wikipedia
- Challenges In Pharma Marketing Poster Presntation Images Tree ...
- Food Court | What Are The Challenges That May Occur When Trying ...
- Process Flowchart | SWOT matrix template | Challenges In Pharma ...
- Food Court | Challenges That You May Come A Cross When You ...
- Business Challenges Clipart
- Cause And Effect Diagram Pmo Office Challenges
- Challenges To Customer Service
- Project Management Area | Software development with ...
- Venn Diagram Examples for Problem Solving. Environmental Social ...
- Path to sustainable development | Venn Diagram Examples for ...
- Block Diagram Challenges Of Product Development
- ConceptDraw | News
- Flowchart Definition | Technical Flow Chart | Process Flowchart ...
- Research onion diagram | Competitor Analysis | PDPC | Research ...