This value chain analysis diagram example illustrates value chain analysis. It was designed on the base of the Wikimedia Commons file: Typical-value-Chain.png. "Typical value chain of agricultural commodities. Belongs to The Organic Business Guide." [commons.wikimedia.org/ wiki/ File:Typical-value-Chain.png]
This file is licensed under the Creative Commons Attribution-Share Alike 3.0 Unported license. [creativecommons.org/ licenses/ by-sa/ 3.0/ deed.en]
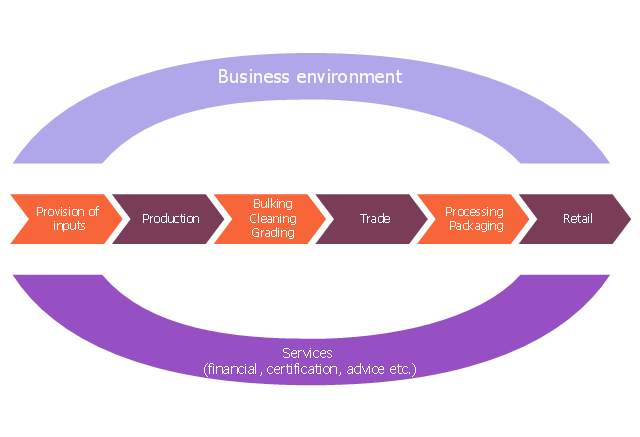
"The agricultural value chain concept has been used since the beginning of the millennium, primarily by those working in agricultural development in developing countries. Although there is no universally accepted definition of the term, it normally refers to the whole range of goods and services necessary for an agricultural product to move from the farm to the final customer or consumer." [Agricultural value chain. Wikipedia]
The marketing chart example "Value chain analysis diagram" was created using the ConceptDraw PRO diagramming and vector drawing software extended with the Marketing Diagrams solution from the Marketing area of ConceptDraw Solution Park.
This file is licensed under the Creative Commons Attribution-Share Alike 3.0 Unported license. [creativecommons.org/ licenses/ by-sa/ 3.0/ deed.en]
"The agricultural value chain concept has been used since the beginning of the millennium, primarily by those working in agricultural development in developing countries. Although there is no universally accepted definition of the term, it normally refers to the whole range of goods and services necessary for an agricultural product to move from the farm to the final customer or consumer." [Agricultural value chain. Wikipedia]
The marketing chart example "Value chain analysis diagram" was created using the ConceptDraw PRO diagramming and vector drawing software extended with the Marketing Diagrams solution from the Marketing area of ConceptDraw Solution Park.
Marketing chart
Competitor Analysis

"A value chain is a chain of activities that a firm operating in a specific industry performs in order to deliver a valuable product or service for the market. ...
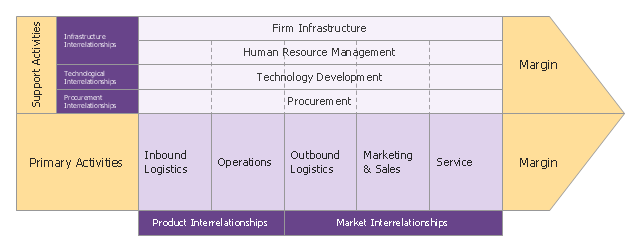
The concept of value chains as decision support tools, was added onto the competitive strategies paradigm developed by Porter as early as 1979. In Porter's value chains, Inbound Logistics, Operations, Outbound Logistics, Marketing and Sales and Service are categorized as primary activities. Secondary activities include Procurement, Human Resource management, Technological Development and Infrastructure." [Value chain. Wikipedia]
This Porter's value chain matrix diagram example was created using the ConceptDraw PRO diagramming and vector drawing software extended with the Matrices solution from the Marketing area of ConceptDraw Solution Park.
Porter's value chain matrix

Porter's Value Chain

Mind Maps for Business - SWOT Analysis

"A root cause is an initiating cause of a causal chain which leads to an outcome or effect of interest. Commonly, root cause is used to describe the depth in the causal chain where an intervention could reasonably be implemented to change performance and prevent an undesirable outcome." [Root cause. Wikipedia]
"Problem-solving consists of using generic or ad hoc methods, in an orderly manner, for finding solutions to problems. Some of the problem-solving techniques developed and used in artificial intelligence, computer science, engineering, mathematics, medicine, etc. are related to mental problem-solving techniques studied in psychology." [Problem solving. Wikipedia]
This root cause analysis (RCA) tree diagram example "Personal problem solution" was created using the ConceptDraw PRO diagramming and vector drawing software extended with the Seven Management and Planning Tools solution from the Management area of ConceptDraw Solution Park.
Tree diagram

How to Make SWOT Analysis in a Word Document

What can be Accomplished with EPC Business Diagrams
HelpDesk
How to Create a Fault Tree Analysis Diagram (FTD)

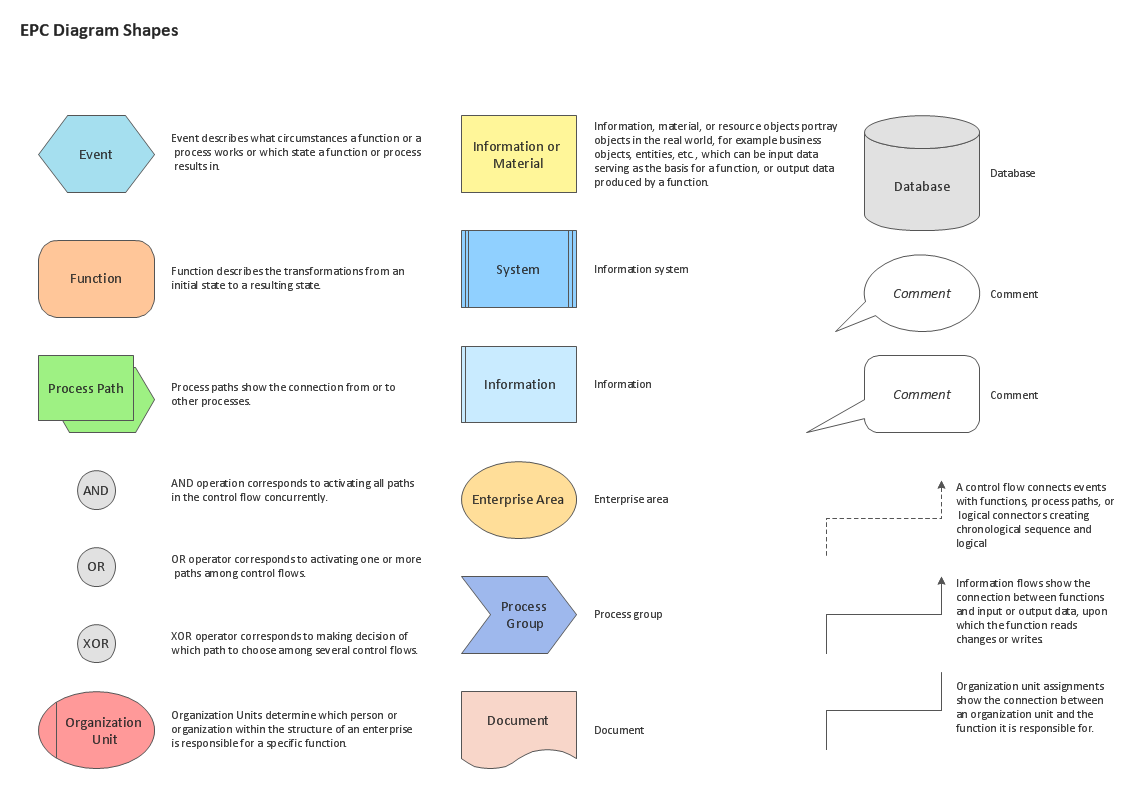
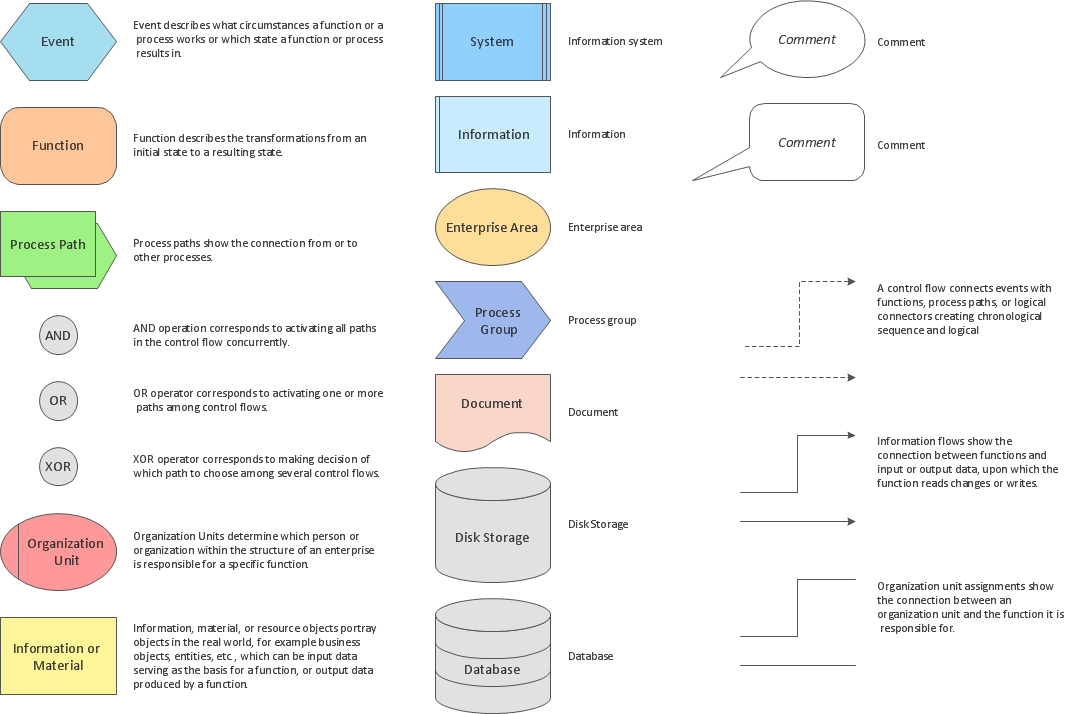
 Event-driven Process Chain Diagrams
Event-Driven Process Chain Diagrams solution extends ConceptDraw DIAGRAM functionality with event driven process chain templates, samples of EPC engineering and modeling the business processes, and a vector shape library for drawing the EPC diagrams and EPC flowcharts of any complexity. It is one of EPC IT solutions that assist the marketing experts, business specialists, engineers, educators and researchers in resources planning and improving the business processes using the EPC flowchart or EPC diagram. Use the EPC solutions tools to construct the chain of events and functions, to illustrate the structure of a business process control flow, to describe people and tasks for execution the business processes, to identify the inefficient businesses processes and measures required to make them efficient.
Software for Drawing EPC Diagrams
The Best Tool for Business Process Modeling

Different Segments of An EPC

SSADM Diagram

- Value Chain Analysis Template
- Competitor Analysis | Porter's value chain matrix diagram | Porter's ...
- Value Chain Analysis Example
- Value Chain Analysis Example School
- Family Chain Analysis
- Mind Maps for Business - SWOT Analysis | Porter's Value Chain ...
- Porter's Value Chain | Competitor Analysis | SWOT Analysis ...
- Competitor Analysis | Porter's Value Chain | Business Productivity ...
- Value Chain Analysis Template Microsoft Word
- Infrastructure Value Chain Analysis
- Value Chain Analysis Flow Chart
- Porter's value chain matrix diagram
- Porter's Value Chain | Deployment Chart Software | SWOT Analysis ...
- Value Chain Analysis Diagram
- Authority Matrix Diagram Software | SWOT analysis matrix diagram ...
- Pyramid Chart Examples | USA Maps | Porters Value Chain Analysis ...
- Flow chart Example. Warehouse Flowchart | Porter's value chain ...
- Fish Value Chain Analysis
- Example Of Value Chain In Service Industry
- Authority Matrix Diagram Software | PROBLEM ANALYSIS ...