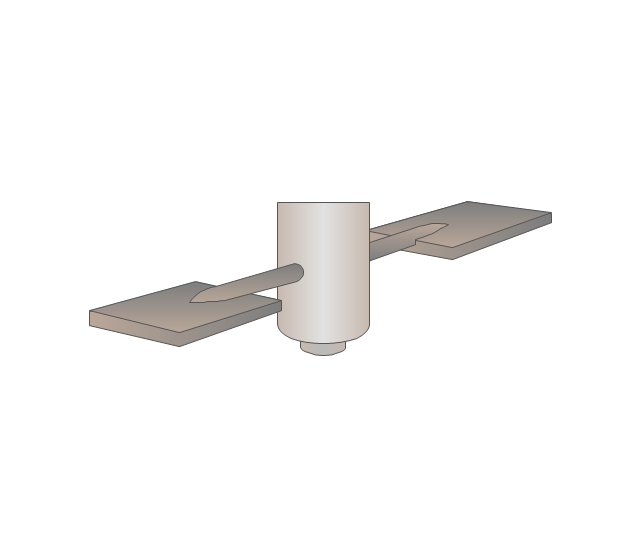
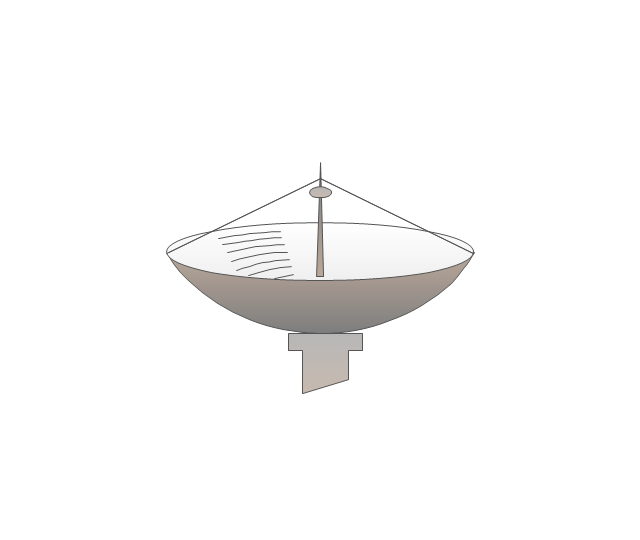
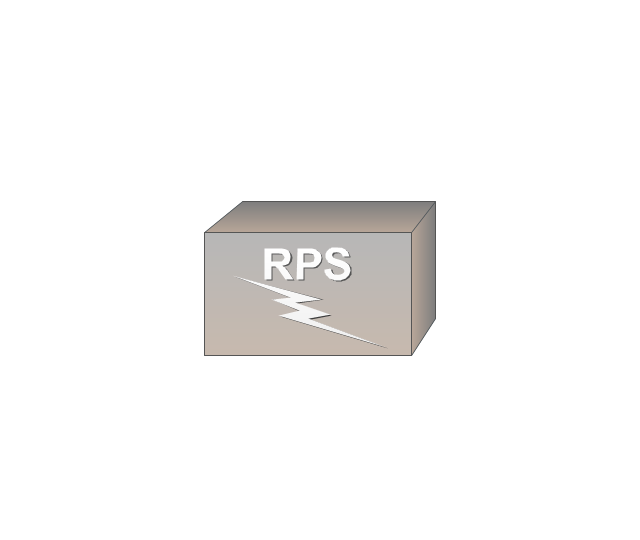
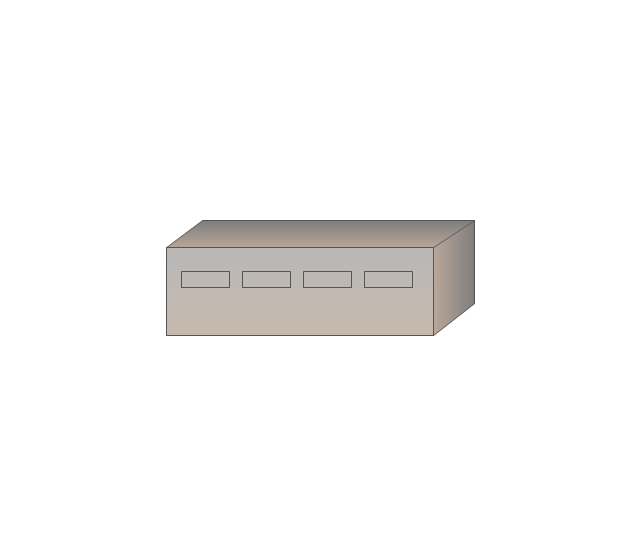
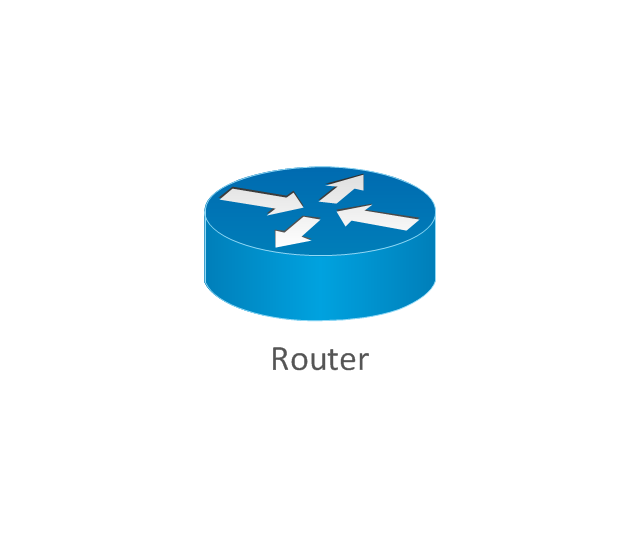
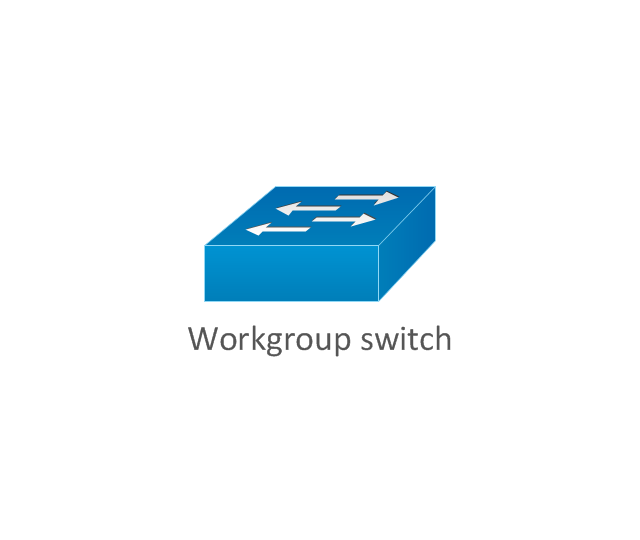
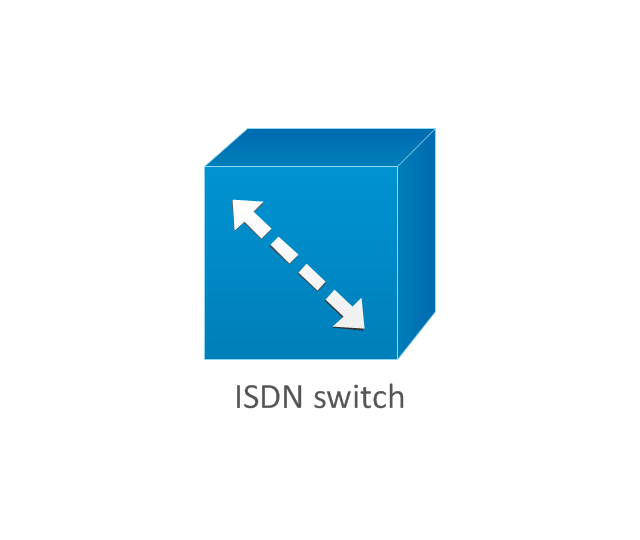
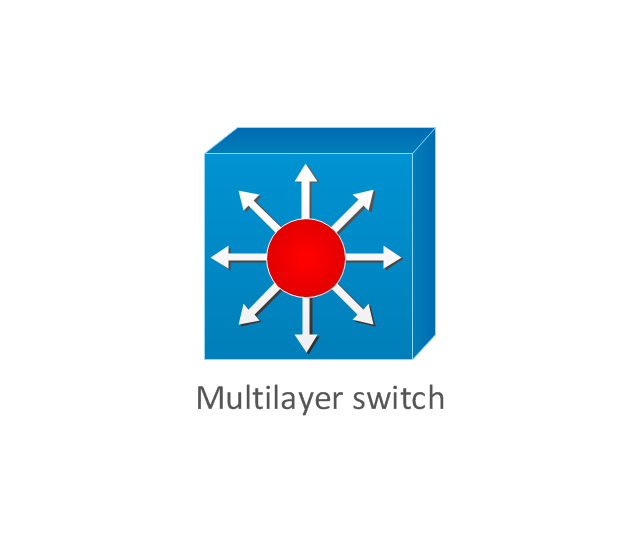
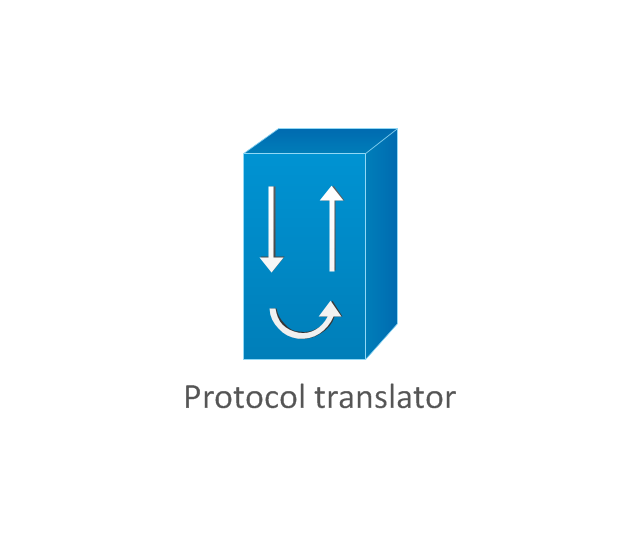
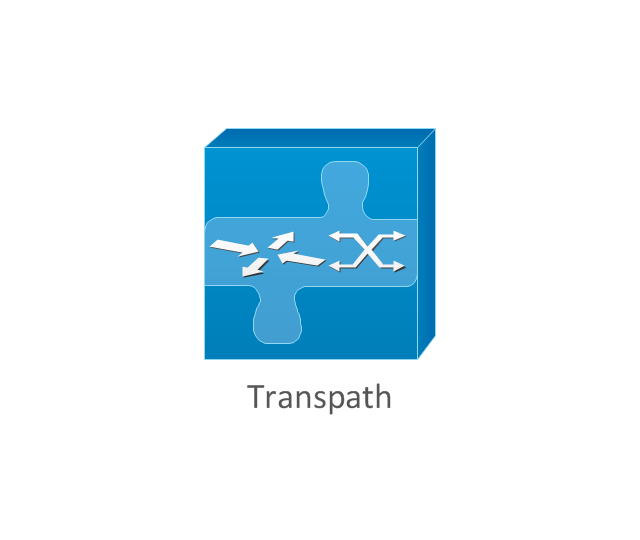
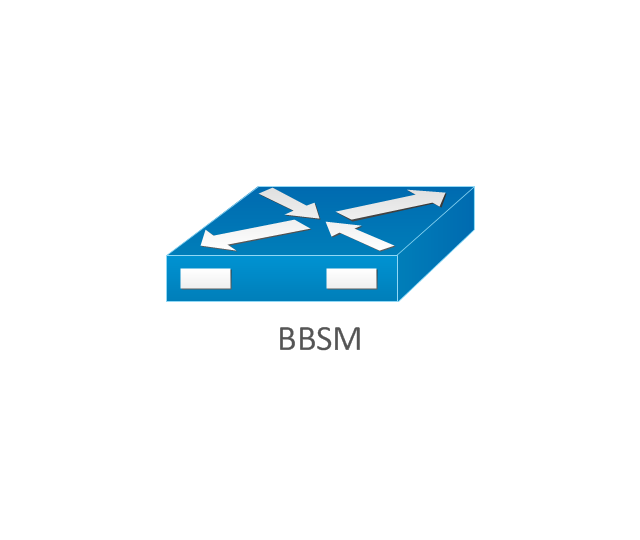
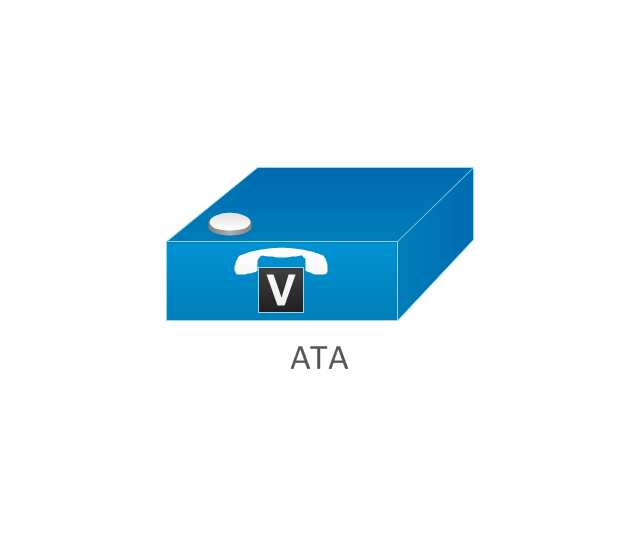
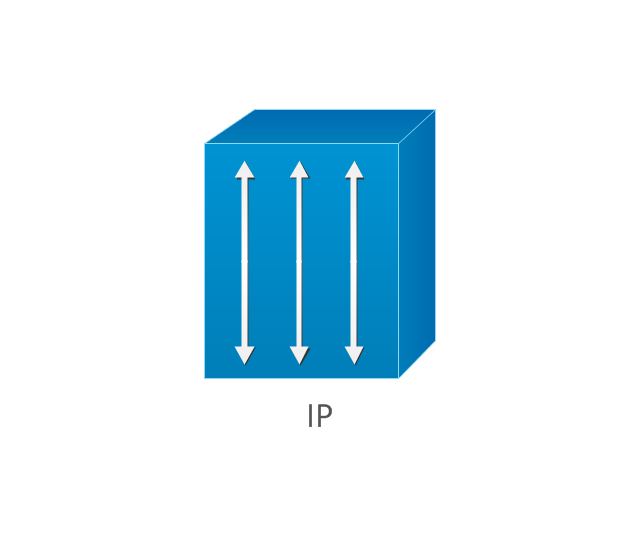
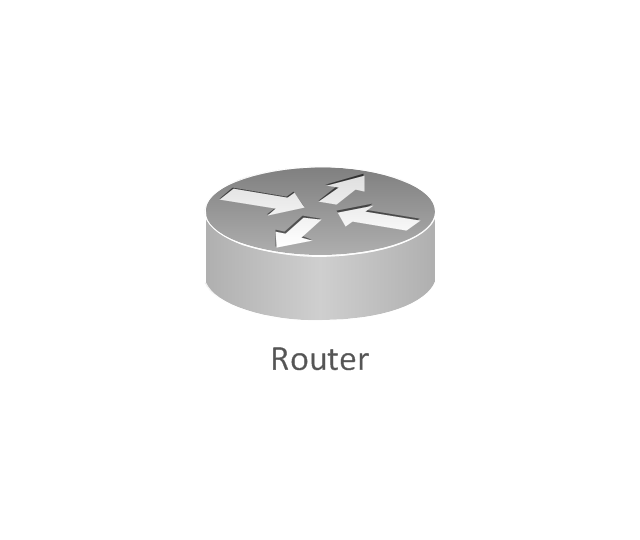
The vector stencils library "Cisco network topology" contains 89 symbols of Cisco network devices and design elements for drawing computer network topology diagrams.
"There are two basic categories of network topologies:
(1) Physical topologies,
(2) Logical topologies.
The shape of the cabling layout used to link devices is called the physical topology of the network. This refers to the layout of cabling, the locations of nodes, and the interconnections between the nodes and the cabling. The physical topology of a network is determined by the capabilities of the network access devices and media, the level of control or fault tolerance desired, and the cost associated with cabling or telecommunications circuits.
The logical topology in contrast, is the way that the signals act on the network media, or the way that the data passes through the network from one device to the next without regard to the physical interconnection of the devices." [Network topology. Wikipedia]
The symbols example "Cisco network topology - Vector stencils library" was created using the ConceptDraw PRO diagramming and vector drawing software extended with the Cisco Network Diagrams solution from the Computer and Networks area of ConceptDraw Solution Park.
www.conceptdraw.com/ solution-park/ computer-networks-cisco
HelpDesk
How to Draw the Different Types of Pie Charts
Using the Pie Chart, you can visually estimate the relative contribution that different data categories contribute to a whole value. The pie chart displays the statistics in a visual format. The main use of pie charts to show comparisons. The larger piece of the pie, the more the value of this value compared to the rest. Various applications of pie charts can be found in business and education. For business, pie charts can be used to compare the success or failure of the goods or services. They may also be used to display the business market share.HelpDesk
How to Draw a Pie Chart Using ConceptDraw PRO
A pie chart represents data, in a clear and easy to read round (pie) form. A circular pie chart is divided into sections (slice). Each "slice" depicts the It reflects the proportion of each component in the whole "pie". This type of chart is most often used for the visualization of statistical data. That is why pie charts are widely used in marketing. As pie charts show proportional proportional parts of a whole, they are good for various visual comparisons. For example, it is difficult to imagine a more intuitive way to show segmentation and market share. ConceptDraw PRO allows you to draw a simple and clear Pie Chart using the Pie Charts solution.HelpDesk
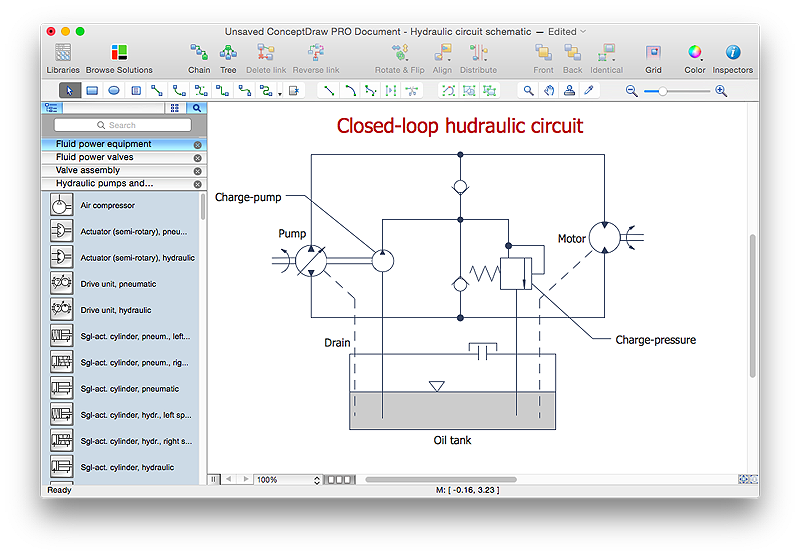
How to Create a Mechanical Diagram
Mechanical Engineering drawing is a type of technical drawing that helps analyze complex engineering systems. Mechanical Engineering diagrams are often a set of detailed drawings used for engineering or construction projects. Making Mechanical Engineering diagram involves many different elements that can be managed using ConceptDraw PRO. You can design elements for drawing parts, assembly, pneumatic, and hydraulic systems for mechanical engineering. With ConceptDraw PRO you can easily create and communicate the Mechanical Engineering diagram of any complexity.
 Divided Bar Diagrams
The Divided Bar Diagrams Solution extends the capabilities of ConceptDraw PRO v10 with templates, samples, and a library of vector stencils for drawing high impact and professional Divided Bar Diagrams and Graphs, Bar Diagram Math, and Stacked Graph.
 Pie Charts
Pie Charts are extensively used in statistics and business for explaining data and work results, in mass media for comparison (i.e. to visualize the percentage for the parts of one total), and in many other fields. The Pie Charts solution for ConceptDraw PRO v10 offers powerful drawing tools, varied templates, samples, and a library of vector stencils for simple construction and design of Pie Charts, Donut Chart, and Pie Graph Worksheets.
HelpDesk
How to Create a Bar Chart in ConceptDraw PRO
Bar charts (bar graphs) are diagrams displaying data as horizontal or vertical bars of certain heights. Bar charts are widely used to show and compare the values of the same parameters for different data groups. The bar graph can be vertical or horizontal. This depends on the amount of categories. There are many methods in which bar graph can be built and this makes it a very often used chart type. Usually, a bar chart is created so that the bars are placed vertically. Such arrangement means that the bar's height value is proportional to the category value. Nevertheless, a bar chart can be also drawn horizontally. This means that the longer the bar, the bigger the category. Thus, a bar chart is a good way to present the relative values of different measured items. The ConceptDraw Bar Graphs solution allows you to draw a bar chart quickly using a vector library, containing the set of various bar charts objects.- Network Topologies | Fully Connected Network Topology Diagram ...
- ConceptDraw PRO Network Diagram Tool | Examples of Flowcharts ...
- How To use Switches in Network Diagram | Computer network ...
- Network equipment and cabling layout - Template | ConceptDraw ...
- 4 Level pyramid model diagram - Information systems types | 5 Level ...
- Network Diagram Template For Project Management
- ConceptDraw PRO Network Diagram Tool | Examples of Flowcharts ...
- Wireless router network diagram | Cisco Routers. Cisco icons ...
- Network Topologies | Hybrid Network Topology | Hotel Network ...
- Man Network Topology Diagram
- Communication network diagram | Cisco Network Topology. Cisco ...
- ATM Network . Computer and Network Examples | UML Use Case ...
- Task Types in ConceptDraw Project | How to Use the Effort-Driven ...
- Cisco Routers. Cisco icons, shapes, stencils and symbols | Cisco ...
- Network Layout Floor Plans | Computer Network Diagrams | Star ...
- ConceptDraw PRO Network Diagram Tool | How to Draw a ...
- ConceptDraw PRO Network Diagram Tool | Network Diagramming ...
- ConceptDraw PRO Network Diagram Tool | Activity on Node ...
- Point to Point Network Topology
- Bus network topology diagram







-cisco-network-topology---vector-stencils-library.png--diagram-flowchart-example.png)
-cisco-network-topology---vector-stencils-library.png--diagram-flowchart-example.png)













-cisco-network-topology---vector-stencils-library.png--diagram-flowchart-example.png)




-cisco-network-topology---vector-stencils-library.png--diagram-flowchart-example.png)
















-cisco-network-topology---vector-stencils-library.png--diagram-flowchart-example.png)
