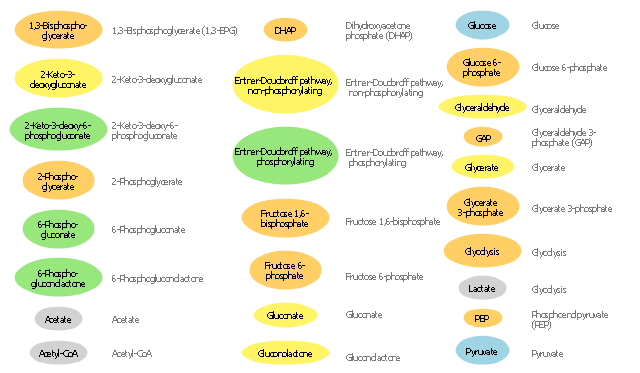
The vector stencils library "Carbohydrate metabolism" contains 25 icons of metabolite symbols.
Use these shapes for drawing carbohydrate metabolism schematics, biochemical diagrams and metabolic pathways maps.
"Carbohydrates are a superior short-term fuel for organisms because they are simpler to metabolize than fats or those amino acids (components of proteins) that can be used for fuel. In animals, the most important carbohydrate is glucose. The concentration of glucose in the blood is used as the main control for the central metabolic hormone, insulin. Starch, and cellulose in a few organisms (e.g., some animals ... and ... microorganisms), both being glucose polymers, are disassembled during digestion and absorbed as glucose. Some simple carbohydrates have their own enzymatic oxidation pathways, as do only a few of the more complex carbohydrates. The disaccharide lactose, for instance, requires the enzyme lactase to be broken into its monosaccharides components; many animals lack this enzyme in adulthood." [Carbohydrate metabolism. Wikipedia]
The shapes example "Design elements - Carbohydrate metabolism" is included in the Biology solution from the Science and Education area of ConceptDraw Solution Park.
Carbohydrate metabolite symbols
Biology Symbols

Biology solution provides 3 libraries with large quantity of vector biology symbols: Biochemistry of Metabolism Library, Carbohydrate Metabolism Library, Citric Acid Cycle (TCA Cycle) Library.
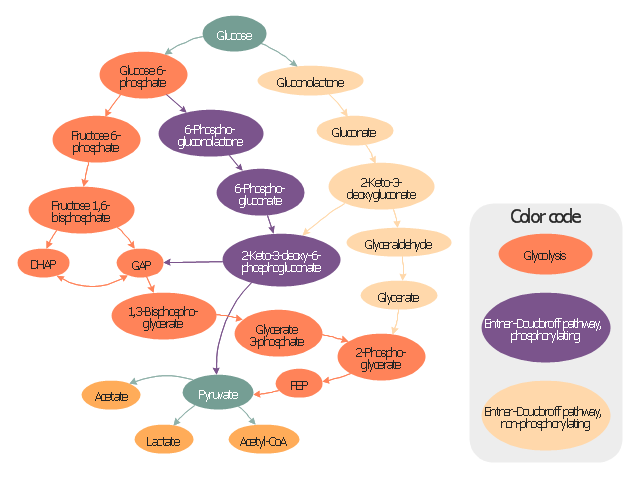
"Carbohydrate catabolism is the breakdown of carbohydrates into smaller units. Carbohydrates literally undergo combustion to retrieve the large amounts of energy in their bonds. Energy is secured by mitochondria in the form of ATP.
There are several different types of carbohydrates: polysaccharides (e.g., starch, amylopectin, glycogen, cellulose), monosaccharides (e.g., glucose, galactose, fructose, ribose) and the disaccharides (e.g., maltose, lactose).
Glucose reacts with oxygen in the following redox reaction, C6H12O6 + 6O2 → 6CO2 + 6H2O, the carbon dioxide and water is a waste product and the chemical reaction is exothermic.
The breakdown of glucose into energy in the form of molecules of ATP is therefore one of the most important biochemical pathways found in living organisms." [Carbohydrate catabolism. Wikipedia]
This glucose catabolism pathways map shows glycolysis by orange color, Entner-Doudoroff phosphorylating pathway by green color, Entner-Doudoroff non-phosphorylating pathway by Yellow color.
This methabolic pathway map was redesigned from Wikimedia file: Glucose catabolism pathways.svg. [commons.wikimedia.org/ wiki/ File:Glucose_ catabolism_ pathways.svg]
The biochemical diagram example "Glucose catabolism pathways map" was created using the ConceptDraw PRO diagramming and vector drawing software extended with the Biology solution from the Science and Education area of ConceptDraw Solution Park.
Catabolic pathway map
Basic Diagramming Flowchart Software

Biology Illustration

Nature Drawings - How to Draw

How can you illustrate the weather condition

Physics Symbols

This line graph sample shows the relative price changes for fresh fruits and vegetables, sugars and sweets, and soft drinks, using the period 1982–84 as the baseline (index = 100), 1978–2002. It was designed on the base of line chart from the website of the U.S. National Center for Chronic Disease Prevention and Health Promotion.
"The number of overweight and obese youth has increased in recent decades, yet few data assess how the lives of children have changed during the “obesity epidemic.” ...
Eating as a primary activity declined, suggesting a shift toward snacking or eating as a secondary activity. Statistically significant trends exist for carbohydrate intake, especially for chips/ crackers/ popcorn/ pretzels (intake tripled from the mid-1970s to the mid-1990s) and soft drinks (intake doubled during the same period). Price and income data suggest possible economic reasons for these changes. The percentage of disposable income spent on food has declined continuously, and almost all of the decline has been represented by food consumed at home, yet today’s disposable income buys more calories than it has in the past. Relative prices have encouraged shifts across food types. From a baseline of 100 during 1982–84, the price index for fresh fruit and vegetables increased to 258 by 2002 (far exceeding general inflation), whereas the price index for soft drinks increased only to 126 by 2002 (below general inflation)." [cdc.gov/ pcd/ issues/ 2005/ apr/ 04_ 0039.htm]
The line chart example "Relative price changes for fresh fruits and vegetables, sugars, sweets, soft drinks" was created using the ConceptDraw PRO diagramming and vector drawing software extended with the Line Graphs solution from the Graphs and Charts area of ConceptDraw Solution Park.
Line chart
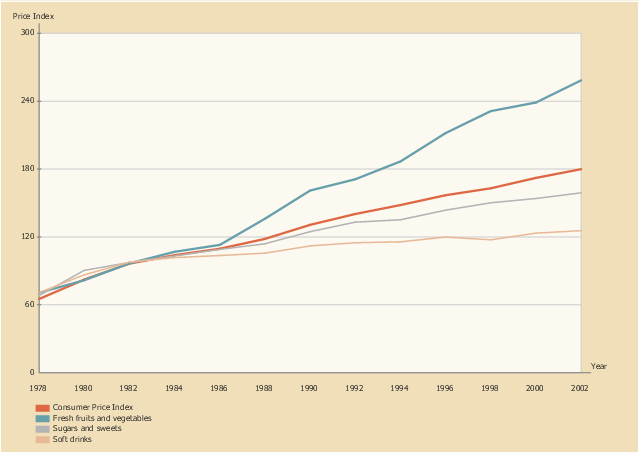
Illustration Software

Biology Drawing Software

Tables’ Beauty

Sales Process

Cisco Network Icons

Chemistry Drawing Software

- Biology | Biology Symbols | Biology Illustration | Carbohydrate ...
- Design elements - Carbohydrate metabolism | Biology | Biology ...
- Biology | Design elements - Carbohydrate metabolism | Simple ...
- Easy Diagram Carbohydrates Metabolism
- Biology | Biology Drawing | Design elements - Carbohydrate ...
- Design elements - Carbohydrate metabolism | Biology | Catabolism ...
- Biology | Glycolysis overview | Design elements - Carbohydrate ...
- Design elements - Carbohydrate metabolism | Glucose catabolism ...
- Design elements - Carbohydrate metabolism | Biology | Chemistry ...
- Design elements - Biochemistry of metabolism | Design elements ...
- Metabolic pathway map - Biochemical diagram | Design elements ...
- Design elements - Carbohydrate metabolism | Design elements ...
- Carbohydrate Metabolism Easy Diagrams
- Design elements - Biochemistry of metabolism | Biology | Design ...
- Flow Chart Of Oxidation Phosphorylation Of Carbohydrate
- Metabolic pathway map - Biochemical diagram | Catabolism ...
- Carbohydrate Metabolism Flow Chart
- Carbohydrate Cycle By Flow Chart
- Biology | Biology Illustration | Carbohydrate Metabolism In Mond ...