 Business Intelligence Dashboard
Business Intelligence Dashboard solution extends the ConceptDraw DIAGRAM functionality with exclusive tools, numerous ready-to-use vector objects, samples and quick-start templates for creation professional Business Intelligence Dashboards, Business Intelligence Graphics, Business Intelligence Charts and Maps of different kinds. Design easy the BI dashboard, BI model or Dynamic chart in ConceptDraw DIAGRAM to monitor the company's work, to track the indicators corresponding your company's data, to display and analyze key performance indicators, to evaluate the trends and regularities of the processes occurring at the company.
 Meter Dashboard
Meter dashboard solution extends ConceptDraw DIAGRAM software with templates, samples and vector stencils library with meter indicators for drawing visual dashboards showing quantitative data.
 Interactive Voice Response Diagrams
Interactive Voice Response Diagrams solution extends ConceptDraw DIAGRAM software with samples, templates and libraries of ready-to-use vector stencils that help create Interactive Voice Response (IVR) diagrams illustrating in details a work of interactive voice response system, the IVR system’s logical and physical structure, Voice-over-Internet Protocol (VoIP) diagrams, and Action VoIP diagrams with representing voice actions on them, to visualize how the computers interact with callers through voice recognition and dual-tone multi-frequency signaling (DTMF) keypad inputs.
 Telecommunication Network Diagrams
Telecommunication Network Diagrams solution extends ConceptDraw DIAGRAM software with samples, templates, and great collection of vector stencils to help the specialists in a field of networks and telecommunications, as well as other users to create Computer systems networking and Telecommunication network diagrams for various fields, to organize the work of call centers, to design the GPRS networks and GPS navigational systems, mobile, satellite and hybrid communication networks, to construct the mobile TV networks and wireless broadband networks.
 Computer and Networks Area
The solutions from Computer and Networks Area of ConceptDraw Solution Park collect samples, templates and vector stencils libraries for drawing computer and network diagrams, schemes and technical drawings.
HelpDesk
How to Create a Telecommunication Network Diagram

HelpDesk
How to Create an Interactive Voice Response (IVR) Diagram
 Diagram")
 Workflow Diagrams
Workflow Diagrams solution extends ConceptDraw DIAGRAM software with samples, templates and vector stencils library for drawing the work process flowcharts.
Network Visualization with ConceptDraw DIAGRAM

 Australia Map
For graphic artists creating accurate maps of Australia. The Australia Map solution - allows designers to map Australia for their needs, offers a collection of scalable graphics representing the political geography of Australia, split into distinct state
SWOT Template

 Windows 10 User Interface
Windows 10 User Interface solution extends significantly ConceptDraw DIAGRAM functionality with look-and-feel functions of GUI software and makes it a great assistant for Win10 designers, developers, and software engineers. This solution provides a wide s
 Android User Interface
The Android User Interface solution allows ConceptDraw DIAGRAM act as an Android UI design tool. Libraries and templates contain a variety of Android GUI elements to help users create images based on Android UI design.
ConceptDraw DIAGRAM Compatibility with MS Visio

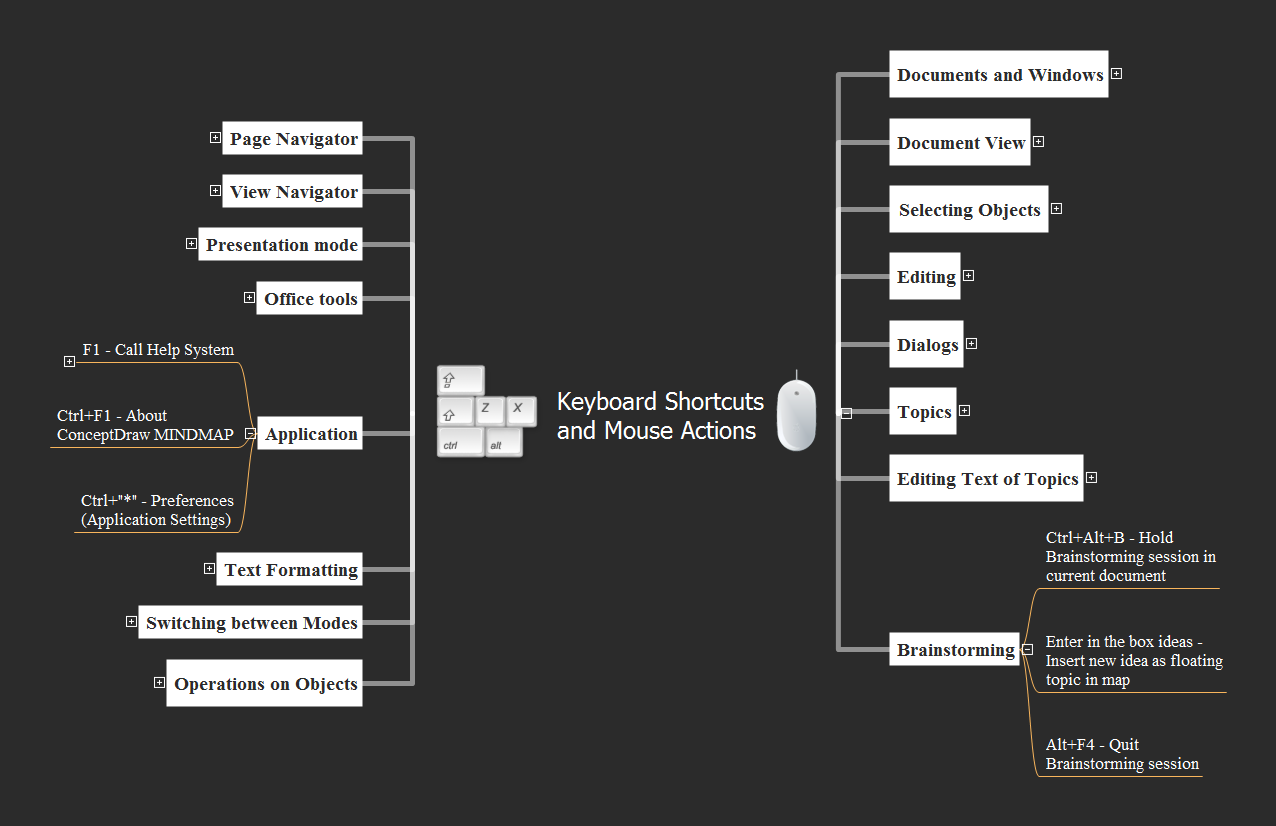
Keyboard Shortcuts and Mouse Actions
- Financial Performance Dashboard
- Free Call Centre Dashboard
- Cafe performance metrics vs. air temperature - Visual dashboard ...
- Business Intelligence Dashboard | How to Make Business ...
- Call center network diagram | Call Center Dashboard | Computers ...
- Swot Analysis For Call Center
- Call Center Dashboard | Meter Dashboard | Telecommunication ...
- Time Series Dashboard | Time series digital dashboard - Template ...
- Call Center Quality Management Dashboard
- What is Interactive Flowcharts | How to Create a Sales Dashboard ...
- Seating Chart For Call Center Office
- Sales Dashboard - insight about potential opportunities and key ...
- How to Use ConceptDraw Sales Dashboard Solution | How to ...
- Time Series Dashboard | Design elements - Time series charts ...
- Kpi Call Center Examples
- Dashboards Examples For It Call Center
- ConceptDraw Dashboard for Facebook | How to Make a Logistic ...
- Call Center Process Flow Diagram
- Apply Call Center Erd Examples
- Call Center Performance Management System Process Flow Chart