Basic Flowchart Symbols and Meaning
Flowcharts are the best for visually representation the business processes and the flow of a custom-order process through various departments within an organization. ConceptDraw PRO diagramming and vector drawing software extended with Flowcharts solution offers the full set of predesigned basic flowchart symbols which are gathered at two libraries: Flowchart and Flowcharts Rapid Draw. Among them are: process, terminator, decision, data, document, display, manual loop, and many other specific symbols. The meaning for each symbol offered by ConceptDraw gives the presentation about their proposed use in professional Flowcharts for business and technical processes, software algorithms, well-developed structures of web sites, Workflow diagrams, Process flow diagram and correlation in developing on-line instructional projects or business process system. Use of ready flow chart symbols in diagrams is incredibly useful - you need simply drag desired from the libraries to your document and arrange them in required order. There are a few serious alternatives to Visio for Mac, one of them is ConceptDraw PRO. It is one of the main contender with the most similar features and capabilities.
 Business Process Workflow Diagrams
The Business Process Workflow Diagrams solution enhances the ConceptDraw PRO v10 functionality with predesigned examples, samples and a numerous collection of predesigned vector objects of workflow chart elements, icons, arrows, connectors, and varied wor
 Cross-Functional Flowcharts
Cross-functional flowcharts are powerful and useful tool for visualizing and analyzing complex business processes which requires involvement of multiple people, teams or even departments. They let clearly represent a sequence of the process steps, the order of operations, relationships between processes and responsible functional units (such as departments or positions).
 Event-driven Process Chain Diagrams
Event-driven Process Chain (EPC) Diagram is a type of flowchart widely used for modeling in business engineering and reengineering, business process improvement, and analysis. EPC method was developed within the Architecture of Integrated Information Systems (ARIS) framework.
UML Diagram Types List
Two types of diagrams are used in UML: Structure Diagrams and Behavior Diagrams. Behavior Diagrams represent the processes proceeding in a modeled environment. Structure Diagrams represent the elements that compose the system.Balanced Scorecard Software
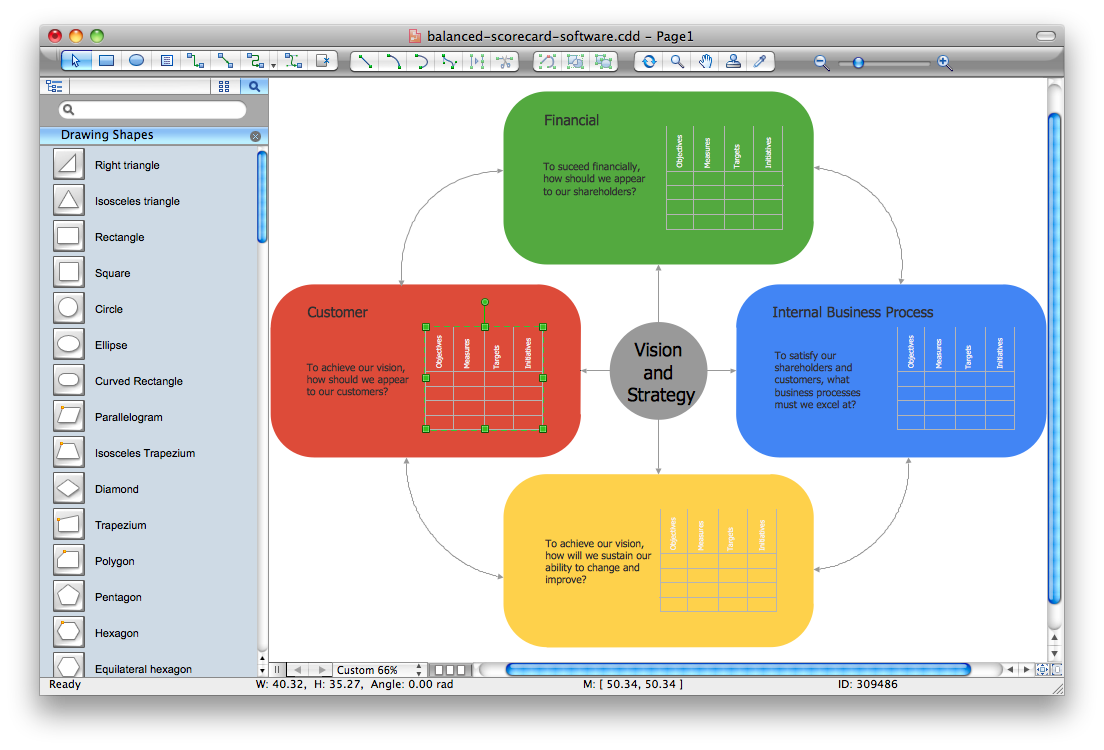
Balanced Scorecard Software provide incredible large variety of samples, templates and libraries of predesigned vector objects. Nothing could be easy that use the predesigned template and fill it, and simply drag the ready-to-use objects for designing your own balanced scorecard diagram.- Workflow Automation Software Comparison
- Payroll process - Swim lane process mapping diagram | Automated ...
- Payroll Business Process
- Process Flowchart | Business Process Modeling Notation Template ...
- Bar Diagrams for Problem Solving. Create manufacturing and ...
- Work Order Process Flowchart. Business Process Mapping ...
- Business Board Org Chart | Kanban Board Software | How to ...
- Organizational Structure | Process Flowchart | Flowchart Definition ...
- Automated payroll management system UML activity diagram ...
- Process Flowchart | Design elements - Workflow diagram | Design ...
- Pyramid Diagram | Pyramid Diagram | 4 Level pyramid model ...
- Swim Lane Flowchart Symbols | Business process BPMN 1.2 (Rapid ...
- Automation Diagram With Symbol
- Pyramid Diagram | Process Flowchart | Value Stream Mapping ...
- Trading process diagram - Deployment flowchart | Financial Trade ...
- IVR customer service hotline diagram | Business Process Diagram ...
- Building Automation System Symbols
- Process Flowchart | Mechanical Drawing Symbols | Design ...
- 4 Level pyramid model diagram - Information systems types | 5 Level ...
- Entity-Relationship Diagram (ERD) | Components of ER Diagram ...


