HelpDesk
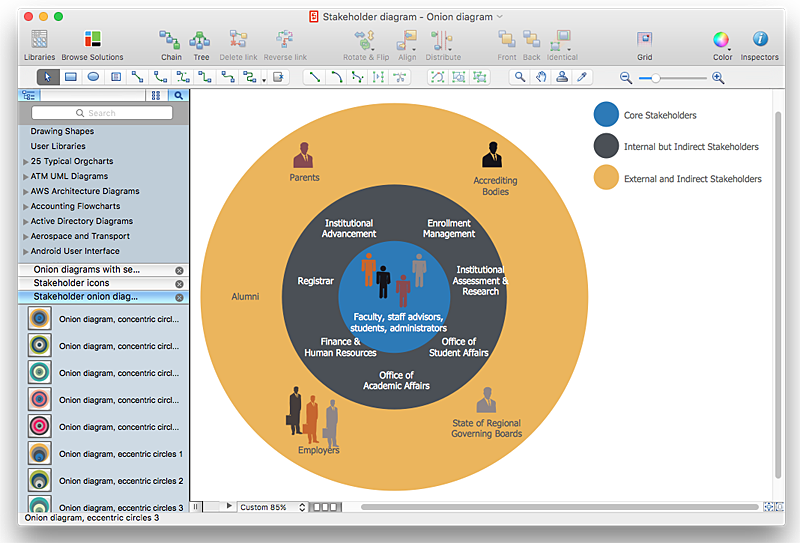
How to Create a Stakeholder Onion Diagram Using ConceptDraw PRO
The Stakeholder Onion Diagram is stakeholder analysis tool from the arsenal of project management. It is used to display the relationships of stakeholders to a project goal. An Onion Diagram shows how the stakeholder activities affect the project results. The ConceptDraw Stakeholder Onion Diagram solution is intended to depict how the relationships that subsists in a project environment can influence on a project. A set of libraries and objects provided by this solution make ashort work of visualizing the stakeholder analysis of a project.
 Cross-Functional Flowcharts
Cross-functional flowcharts are powerful and useful tool for visualizing and analyzing complex business processes which requires involvement of multiple people, teams or even departments. They let clearly represent a sequence of the process steps, the order of operations, relationships between processes and responsible functional units (such as departments or positions).
HelpDesk
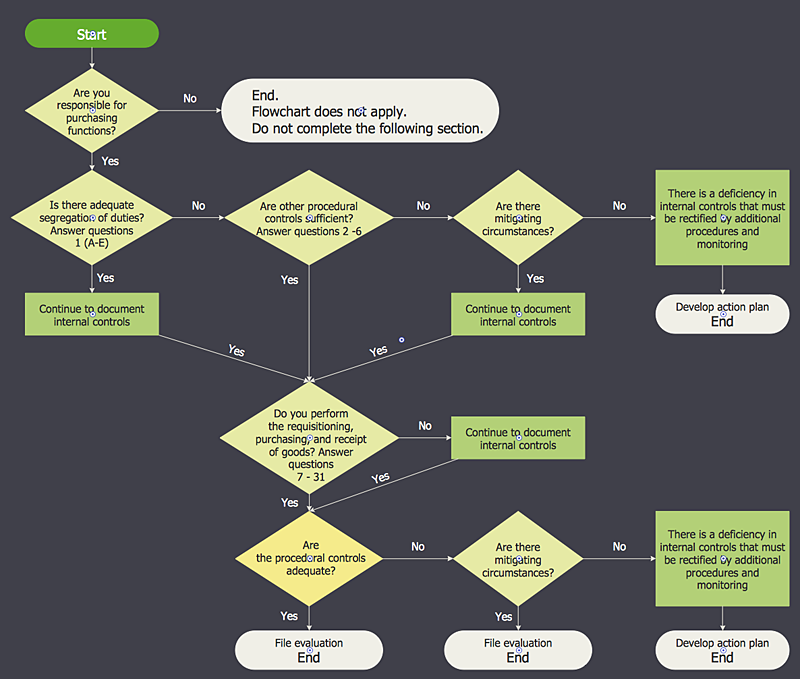
How to Create an Accounting Flowchart Using ConceptDraw Solution Park
An Accounting flowchart is a specialized type of flowchart. With the help of an accounting flowchart you can visually describe tasks, documents, people responsible for execution at each stage of accounting workflow. Find out how you can easily create an accounting flowchart of any complexity using Accounting Flowchart Solution from the ConceptDraw Solution Park.HelpDesk
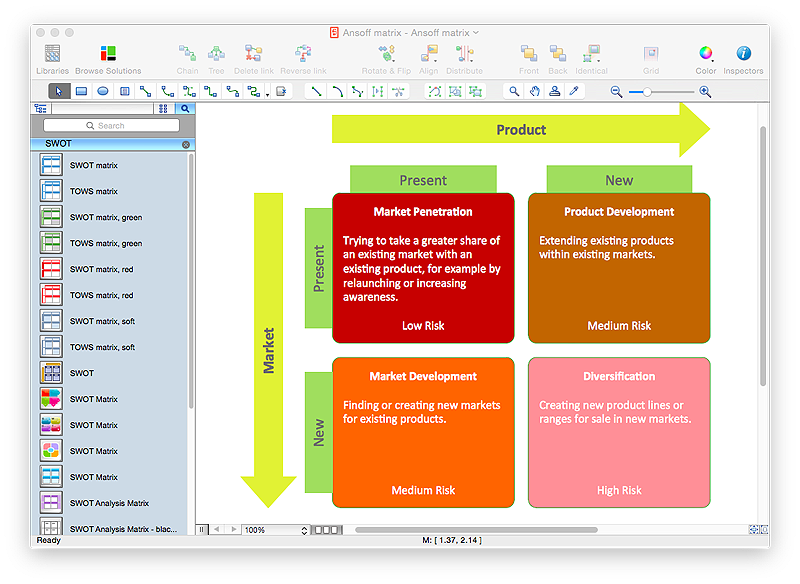
How to Make an Ansoff Matrix Template in ConceptDraw PRO
Ansoff Matrix is a business strategic management tool that helps a business determine its product and market growth strategy. Ansoff matrix has four sections to show each impacting ways that businesses can grow. Using Ansoff Matrix enables determining the current position of any business in the industry and choose the direction of its growth, which would provide the most competitive position. While Ansoff Matrix is most commonly used as a business planning tool it can be used also for personal development. You can make Ansoff Matrix template for your organization using ConceptDraw PRO Matrices solution.- Basic Flowchart Symbols and Meaning | Flow chart Example ...
- Employee Management System Flow Chart Pdf
- How to Draw an Organization Chart | Organizational Structure | How ...
- Library Management Scenarios Of Cross Functional Flowchart
- HR management process - Flowchart | Human Resource ...
- Cross-Functional Flowcharts
- Process Flowchart | Total Quality Management Definition | Total ...
- HR management process - Flowchart | Types of Flowchart ...
- HR management process - Flowchart | Types of Flowchart ...
- Flowchart Of Library Management System
- Business Process Management Flow Chart
- Flow Chart Creator | Trading process diagram - Deployment ...
- Opportunity flowchart - Template | Replacing engine oil - Opportunity ...
- Types of Flowchart - Overview | HR management process ...
- Management Flow Chart Template
- Hiring Process Flow Chart Example
- Flow Chart Symbols | Hiring process workflow | Flowchart design ...
- Types of Flowchart - Overview | HR management process ...
- Bank Management System Flowchart
- Process Flowchart | Basic Flowchart Symbols and Meaning | Flow ...


