 Business Intelligence Dashboard
Business Intelligence Dashboard solution extends the ConceptDraw PRO v11 functionality with exclusive tools, numerous ready-to-use vector objects, samples and quick-start templates for creation professional Business Intelligence Dashboards, Business Intelligence Graphics, Business Intelligence Charts and Maps of different kinds. Design easy the BI dashboard, BI model or Dynamic chart in ConceptDraw PRO to monitor the company's work, to track the indicators corresponding your company's data, to display and analyze key performance indicators, to evaluate the trends and regularities of the processes occurring at the company.
 Education Package
Education Package is a comprehensive set of multifarious graphical solutions from ConceptDraw Solution Park, collected together in help to ConceptDraw PRO users working in a field of science, education and training, which is aimed at improving the quality of education and helping to design with ease variety of interesting and colorful educational materials, diagrams, charts and maps. Use it to present the information and knowledge in an interesting, clear, structured and simple form to achieve a success in education and pedagogy, to maintain the interest of students and pupils throughout the whole learning process, at the lectures, lessons and even during independent work with additional materials, to contribute to better perception of scientific information by listeners during the conferences and reports.
Business Intelligence Dashboard Software

Sales Dashboard - Access Anywhere
Sales Dashboards for Your Company

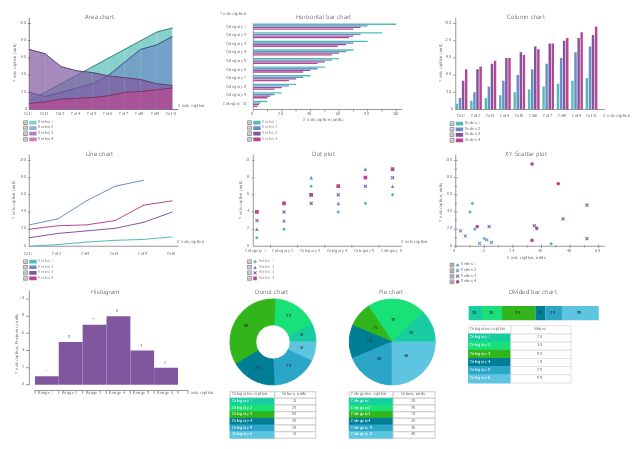
The vector stencils library "BI charts" contains 10 graph templates.
Use it to visualize business metrics on your business intelligence dashboards in ConceptDraw PRO software.
"A chart can take a large variety of forms, however there are common features that provide the chart with its ability to extract meaning from data.
Typically the data in a chart is represented graphically, since humans are generally able to infer meaning from pictures quicker than from text. Text is generally used only to annotate the data." [Chart. Wikipedia]
The graph and chart templates example "Design elements - BI charts" is included in the Business Intelligence Dashboards solution from the Business Processes area of ConceptDraw Solution Park.
Graphs and charts
Dashboard Software
Business Graphics Software
- New Business Intelligence Dashboard Solution for ConceptDraw PRO
- Business Graphics Software | KPI Dashboard | Business Intelligence ...
- Sales Dashboard | Sales Dashboard | Business Intelligence ...
- Dashboard Software | Business Intelligence Dashboard Software ...
- Process Flowchart | Business Intelligence Dashboard | Flowchart ...
- ConceptDraw | Press Releases
- Design elements - Sales dashboard | Sales Dashboard - Access ...
- Business Intelligence Dashboard | Sales Dashboards for Your ...
- Competitor Analysis | Pyramid Chart Examples | Create Graphs and ...