Basic Flowchart Symbols and Meaning


ERD Symbols and Meanings


Process Flowchart


Electrical Symbols — Terminals and Connectors

 macOS User Interface
macOS User Interface solution extends the ConceptDraw PRO functionality with powerful GUI software graphic design features and tools. It provides an extensive range of multifarious macOS Sierra user interface design examples, samples and templates, and wide variety of libraries, containing a lot of pre-designed vector objects of Mac Apps icons, buttons, dialogs, menu bars, indicators, pointers, controls, toolbars, menus, and other elements for fast and simple designing high standard user interfaces of any complexity for new macOS Sierra.
UML Class Diagram


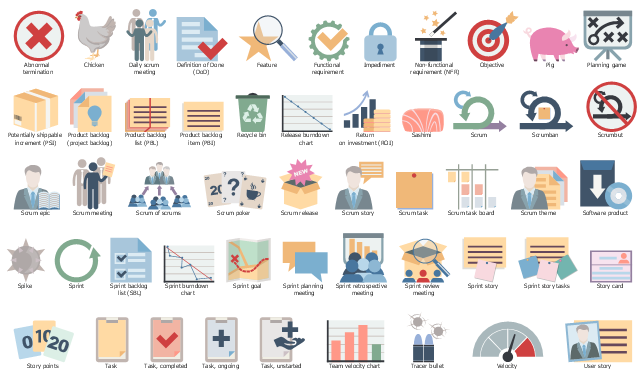
The vector stencils library "Scrum artifacts" contains 52 icons.
Use this clipart set to design your agile software development diagrams and infographics with ConceptDraw PRO software.
"Product backlog
The product backlog comprises an ordered list of requirements that a scrum team maintains for a product. It consists of features, bug fixes, non-functional requirements, etc.—whatever must be done to successfully deliver a viable product. The product owner orders the product backlog items (PBIs) based on considerations such as risk, business value, dependencies, and date needed. ...
Sprint backlog
The sprint backlog is the list of work the development team must address during the next sprint. The list is derived by the scrum team selecting product backlog items from the top of the product backlog until the development team feels it has enough work to fill the sprint. This is done by the development team asking "Can we also do this?" and adding product backlog items to the sprint backlog. The development team should keep in mind its past performance assessing its capacity for the new sprint, and use this as a guide line of how much "effort" they can complete.
The product backlog items may be broken down into tasks by the development team. Tasks on the sprint backlog are never assigned; rather, tasks are signed up for by the team members as needed according to the set priority and the development team member skills. This promotes self-organization of the development team, and developer buy-in. ...
Sprint burn-down chart
The sprint burndown chart is a public displayed chart showing remaining work in the sprint backlog. Updated every day, it gives a simple view of the sprint progress. ...
Release burn-down chart
The release burndown chart is the way for the team to track progress and provide visibility. The release burndown chart is updated at the end of each sprint by the scrum master. The horizontal axis of the release burndown chart shows the sprints; the vertical axis shows the amount of work remaining at the start of each sprint." [Scrum (software development). Wikipedia]
The clip art sample "Design elements - Scrum artifacts" is included in the Scrum solution from the Project Management area of ConceptDraw Solution Park.
Clipart set
 AWS Architecture Diagrams
AWS Architecture Diagrams with powerful drawing tools and numerous predesigned Amazon icons and AWS simple icons is the best for creation the AWS Architecture Diagrams, describing the use of Amazon Web Services or Amazon Cloud Services, their application for development and implementation the systems running on the AWS infrastructure. The multifarious samples give you the good understanding of AWS platform, its structure, services, resources and features, wide opportunities, advantages and benefits from their use; solution’s templates are essential and helpful when designing, description and implementing the AWS infrastructure-based systems. Use them in technical documentation, advertising and marketing materials, in specifications, presentation slides, whitepapers, datasheets, posters, etc.
Wireframe Tools

- Data Bullet Point Png
- Red Arrow Bullet Point Png
- Bullet Point Png
- Point Bullet Symbol Icon Png
- HR arrows - Vector stencils library | Png Bullet Point Ribbon
- Bullet Symbols Png File
- Elements location of a welding symbol | Sales arrows - Vector ...
- Bullet Librery Png
- Bullet Point Symbol
- Numbered List Icon