This site uses cookies. By continuing to browse the ConceptDraw site you are agreeing to our Use of Site Cookies.
HelpDesk

How to Add a Bubble Diagram to MS Word

A bubble chart is a diagram in which the data points are replaced with bubbles, and the size of the bubbles represents some additional dimension of the data. A bubble chart does not have the axis. A bubble chart can be used instead of a scatter diagram if the data has three dimensions, each of that containing the set of values. The sizes of the bubbles are determined by the values in the third dimension. Any additional information about the entities beyond their three primary dimensions can be depicted by rendering bubbles in colors and patterns that are selected in a certain way. The legend containing the further information can be added to a bubble diagram. ConceptDraw DIAGRAM allows you to easily create various business management and marketing charts, including bubble diagrams and then add them to a MS Word document.
HelpDesk

How to Create a Bubble Diagram

Bubble Diagram is a simple chart that consists of circles (bubbles) repesening certain topics or processes. Bubbles are connected by lines depicting the type of relationships between the bubbles. The size of each bubble is depended on the importance of the entity it represents. Bubble charts are widely used throughout social, economical, medical, and other scientific researches as well as throughout architecture and business management. Bubble charts are often used during the early stages of product development to visualize thoughts and ideas for the purpose of sketching out a development plan. ConceptDraw DIAGRAM allows you to draw a bubble diagrams using the Bubble Diagrams solution.

bubble chart, bubble chart creator, bubble diagram Bubble Diagrams

bubble chart, bubble chart creator, bubble diagram
Bubble diagrams have enjoyed great success in software engineering, architecture, economics, medicine, landscape design, scientific and educational process, for ideas organization during brainstorming, for making business illustrations, presentations, planning, design, and strategy development. They are popular because of their simplicity and their powerful visual communication attributes.
HelpDesk

How To Create Visio Bubble Chart

ConceptDraw DIAGRAM allows you to easily create business charts and diagrams of any complexity, including the bubbles diagram and then make a MS Visio file from your diagram in a few simple steps.
HelpDesk

How to Add a Bubble Diagram to PowerPoint Presentation

Bubble diagrams can be used to compare concepts, and identify areas of similarity and difference. ConceptDraw DIAGRAM allows you to make a MS PowerPoint Presentation from your charts in a few simple steps.
HelpDesk

How to Create Cisco Network Diagram

The easiest way to design Cisco Network diagram using standard Cisco product symbols is using ConceptDraw DIAGRAM powered by Cisco Network Diagrams solution. The Cisco Network Diagrams solution uses Cisco network symbols to visually document the topology and design of Cisco networks. Use a Cisco Network diagram to display the topology of a Cisco network. A diagram clearly depicting servers, computers, routers, and other parts of your network help to easily manage and control the network and the services it uses.

Examples of Flowcharts, Org Charts and More

ConceptDraw DIAGRAM covers a broad spectrum of business graphics categories and offers at ConceptDraw STORE enormous online collection of pictorial examples and samples for different thematics and application areas. It is a plentiful source of inspiration and wonderful examples of professionally designed diagrams, flowcharts, UML diagrams, organizational charts, databases, ERDs, network diagrams, business charts, different thematic charts, schematics, infographics and plans developed specially for knowledge workers, engineers, managers, businessmen, marketing specialists, analytics, scientists, students, professors, journalists and also for a large number of other people that every day use various diagrams and drawings in their work and life activity. Each of these examples is a real art, all they are well thought-out and designed without efforts with help of powerful tools of ConceptDraw DIAGRAM software. ConceptDraw examples display all variety of tasks, possibilities and results that ConceptDraw Product Line lets achieve fast and easy. ConceptDraw is one of the best Visio alternatives for Mac. It open all Visio formats like.vsdx,.vss,.vdx files and allows you to export files to Visio formats.
What is ConceptDraw OFFICE

network topology diagram software, network icons, network diagram template, networking icons available, how to draw a network diagram Computer Network Diagrams

network topology diagram software, network icons, network diagram template, networking icons available, how to draw a network diagram
Computer Network Diagrams solution extends ConceptDraw DIAGRAM software with samples, templates and libraries of vector icons and objects of computer network devices and network components to help you create professional-looking Computer Network Diagrams, to plan simple home networks and complex computer network configurations for large buildings, to represent their schemes in a comprehensible graphical view, to document computer networks configurations, to depict the interactions between network's components, the used protocols and topologies, to represent physical and logical network structures, to compare visually different topologies and to depict their combinations, to represent in details the network structure with help of schemes, to study and analyze the network configurations, to communicate effectively to engineers, stakeholders and end-users, to track network working and troubleshoot, if necessary.

ConceptDraw Solution Park ConceptDraw Solution Park

ConceptDraw Solution Park
ConceptDraw Solution Park collects graphic extensions, examples and learning materials

Cisco networking, Cisco network icons, Cisco icon Cisco Network Diagrams

Cisco networking, Cisco network icons, Cisco icon
Cisco Network Diagrams solution extends ConceptDraw DIAGRAM with the best characteristics of network diagramming software. Included samples, templates and libraries of built-in standardized vector Cisco network icons and Cisco symbols of computers, network devices, network appliances and other Cisco network equipment will help network engineers, network designers, network and system administrators, as well as other IT professionals and corporate IT departments to diagram efficiently the network infrastructure, to visualize computer networks topologies, to design Cisco computer networks, and to create professional-looking Cisco Computer network diagrams, Cisco network designs and schematics, Network maps, and Network topology diagrams in minutes.

telecommunication networking, networking and telecommunications, telecommunications network, computer systems networking and telecommunications Telecommunication Network Diagrams

telecommunication networking, networking and telecommunications, telecommunications network, computer systems networking and telecommunications
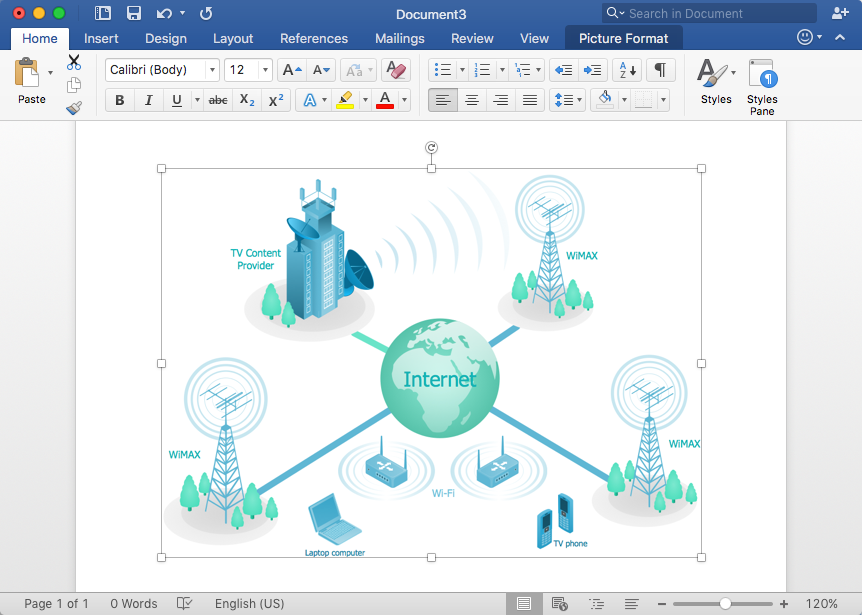
Telecommunication Network Diagrams solution extends ConceptDraw DIAGRAM software with samples, templates, and great collection of vector stencils to help the specialists in a field of networks and telecommunications, as well as other users to create Computer systems networking and Telecommunication network diagrams for various fields, to organize the work of call centers, to design the GPRS networks and GPS navigational systems, mobile, satellite and hybrid communication networks, to construct the mobile TV networks and wireless broadband networks.

How To Create a Bubble Chart

Bubble diagrams solution extends ConceptDraw DIAGRAM software with templates, Using ConceptDraw Connectors, you can create a bubble chart in moments. Using ConceptDraw you will be able to create a bubble chart from the ready ConceptDraw library objects or make your own objects. The created diagram can represent ideas organization, in brainstorming processes, by teachers for explaining difficult ideas or for presentations.
HelpDesk

How to Add a Telecommunication Network Diagram to MS Word

ConceptDraw DIAGRAM allows you to easily create telecom network diagrams and then insert them into a MS Word document.

SWOT analysis, TOWS analysis SWOT and TOWS Matrix Diagrams

SWOT analysis, TOWS analysis
SWOT and TOWS Matrix Diagrams solution extends ConceptDraw DIAGRAM and ConceptDraw MINDMAP software with features, templates, samples and libraries of vector stencils for drawing SWOT and TOWS analysis matrices and mind maps.

food art, food pictures, pictures of food, food court, food images, fruit art, pictures of vegetables Food Court

food art, food pictures, pictures of food, food court, food images, fruit art, pictures of vegetables
Use the Food Court solution to create food art. Pictures of food can be designed using libraries of food images, fruit art and pictures of vegetables.
HelpDesk

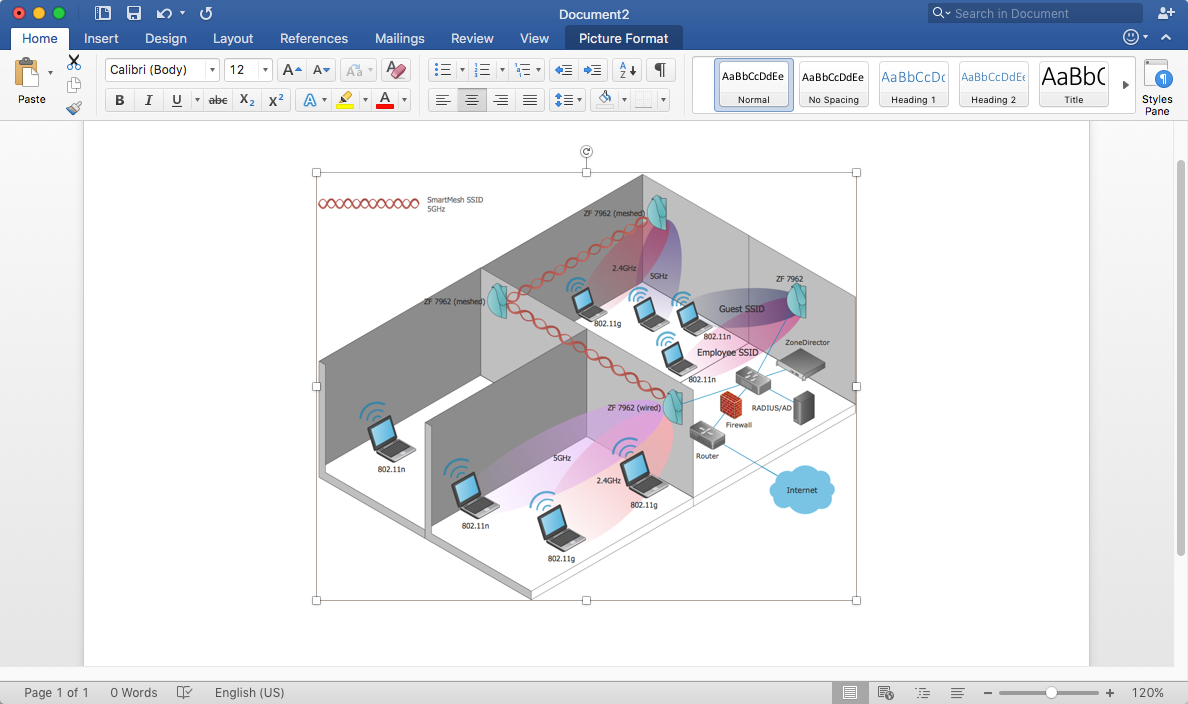
How to Add a Wireless Network Diagram to MS Word Document

ConceptDraw DIAGRAM allows you to easily create wireless computer network diagrams and then insert them into an MS Word document.
HelpDesk

How to Create a Computer Network Diagram

Computer Network diagram is intended to depict how a computer network is built and connected. It shows how data transfers between connections and presents an overview of hardware and devices used. With the ConceptDraw solution for Computer Network Diagrams, system administrators, network architects, and other related IT specialists have a perfect drawing tool that supplies adjective vector stencils representing hardware, telecom devices, and logical symbols that enhance possibilities in network diagramming, however, complex the real network may be.

wireless communications, WLAN, wireless solution, wireless networking Wireless Networks

wireless communications, WLAN, wireless solution, wireless networking
The Wireless Networks Solution extends ConceptDraw DIAGRAM software with professional diagramming tools, set of wireless network diagram templates and samples, comprehensive library of wireless communications and WLAN objects to help network engineers and designers efficiently design and create Wireless network diagrams that illustrate wireless networks of any speed and complexity, and help to identify all required equipment for construction and updating wireless networks, and calculating their costs.
HelpDesk

How to Create a Timeline Diagram

A Timeline is a chart which displays a project plan schedule in chronological order. A Timeline is used in project management to depict project milestones and visualize project phases and show project progress. The graphic form of a timeline makes it easy to understand critical project milestones, such as the progress of a project schedule. Timelines are particularly useful for project scheduling or project management when accompanied with a Gantt chart. It captures the main of what the project will accomplish and how it will be done. making a project timeline is one of the most important skills a project manager needs have. Making comprehensive, accurate timelines allows you getting every project off in the best way. ConceptDraw DIAGRAM allows you to draw a timeline chart using a special library.