This site uses cookies. By continuing to browse the ConceptDraw site you are agreeing to our Use of Site Cookies.

Flowchart Examples and Templates

ConceptDraw provides a wide variety of examples such as flowcharts, organizational charts, business charts, and lots more. Please choose any examples you are interested in, alternatively download them for free; you will need to install ConceptDraw to view them. As you will see, ConceptDraw is very powerful, you can use more than 10000 symbols, examples, and many pre-drawn templates, to create your own spectacular flowcharts, business diagrams, and lots more, effortlessly, and in no time at all.

Flowchart Components

The ConceptDraw Flowchart component includes a set of samples and templates. This geathered as flowchart maker toolbox which focused on drawing flowcharts of any industry standards.

Pyramid Diagram and Pyramid Chart

Pyramid Diagram is very useful to illustrate the foundation-based relationships. ConceptDraw DIAGRAM, a business charting software, includes some build-in symbols for designer to draw all kind of the pyramid diagrams.

House of Quality Matrix Software

House of Quality Matrix Software - Use the predesigned objects from the Involvement Matrix Objects Library from the Seven Management and Planning Tools Solution to create professional looking House of Quality Matrices in minutes.

healthy foods, healthy diet, healthy food recipes Health Food

healthy foods, healthy diet, healthy food recipes
The Health Food solution contains the set of professionally designed samples and large collection of vector graphic libraries of healthy foods symbols of fruits, vegetables, herbs, nuts, beans, seafood, meat, dairy foods, drinks, which give powerful possi

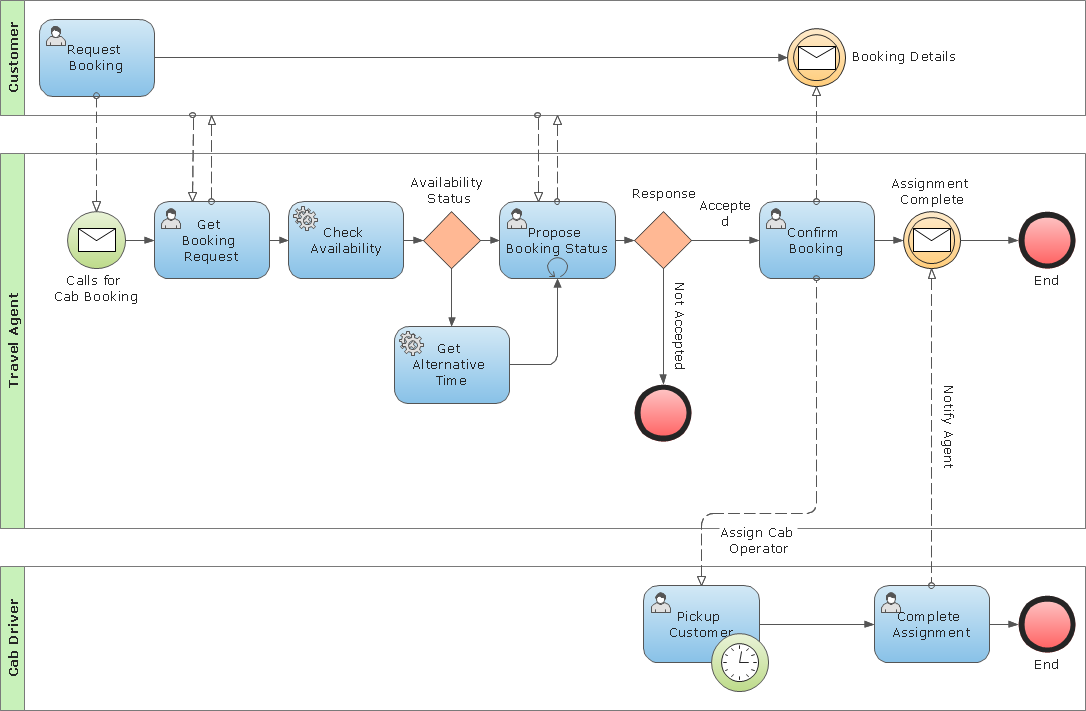
Business Process Modeling Notation Template

Create business process diagrams (BPMN 2.0.) with ConceptDraw using professional looking templates. ConceptDraw is business process improvement tools.

histogram, flow chart, pareto chart, fishbone diagram, quality control Seven Basic Tools of Quality

histogram, flow chart, pareto chart, fishbone diagram, quality control
Manage quality control in the workplace, using fishbone diagrams, flowcharts, Pareto charts and histograms, provided by the Seven Basic Tools of Quality solution.

Positioning Map

ConceptDraw DIAGRAM is a powerful diagramming and vector drawing software. Extended with Matrices Solution from the Marketing Area of ConceptDraw Solution Park it became the best software for quick and easy designing various types of Matrix Diagrams, including Positioning Map.

Design Pictorial Infographics. Design Infographics

In the course of recent decades data visualization went through significant development and has become an indispensable tool of journalism, business intelligence and science. The way visual information may be conveyed is not limited simply to static or dynamic representation, it can also be interactive. Infographics can be conditionally divided into several general levels. Primarily, this is level of visualization of information, its interpretation and association on any ground. Second level can be defined as a visualization of knowledge, depiction of thoughts and ideas in the form of images or diagrams. Finally, the level of data visualization, which processes data arrays in charts, enabling the information to be more clearly perceived. You can also identify the main approaches to the creation of infographics: exploratory and narrative. Exploratory method insists on minimalist design in favor of data precision without unnecessary details and is common for scientific researches and ana