This site uses cookies. By continuing to browse the ConceptDraw site you are agreeing to our Use of Site Cookies.

Introduction to bookkeeping: Accounting flowchart process

Everything about Bookkeeping: Accounting flowchart process. Which symbols to use, how to make a chart.

How Do You Make An Accounting Process Flowchart?

To describe the accounting processing use ConceptDraw Flowchart set of symbold created for Accounting data processing.
Tips, Methods and Symbols on How to Create Flowcharts for an Accounting Information System.

Copying Service Process Flowchart. Flowchart Examples

This sample was created in ConceptDraw DIAGRAM diagramming and vector drawing software using the Flowcharts solution from the Diagrams area of ConceptDraw Solution Park.
This sample shows the Flowchart on that it is displayed the process of the determination the permissibility according the Access Copyright license. The diamonds represent the decision points. Inside the diamonds are the questions that need the answer yes/no. It is necessary to answer on the question, make the decision that will determine the next step.

Easy Flowchart Software

ConceptDraw the easy flowchart software that gives users the ability to draw any type of flowcharts. Fast visualization of the structured data with the vector stencils from object libraries by using RapidDraw technology.

Accounting Data Flow from the Accounting Flowcharts Solution

Accounting Data Flow from the Accounting Flowcharts Solution visually describes the financial accounting process, shows the accumulated information about transactions and events for creating the balance sheet and the final income statement.
Accounting Flowcharts Solution contains also a wide variety of templates and samples that you can use as the base for your own Accounting Flowcharts of any complexity.

Business Process Modeling Notation Template
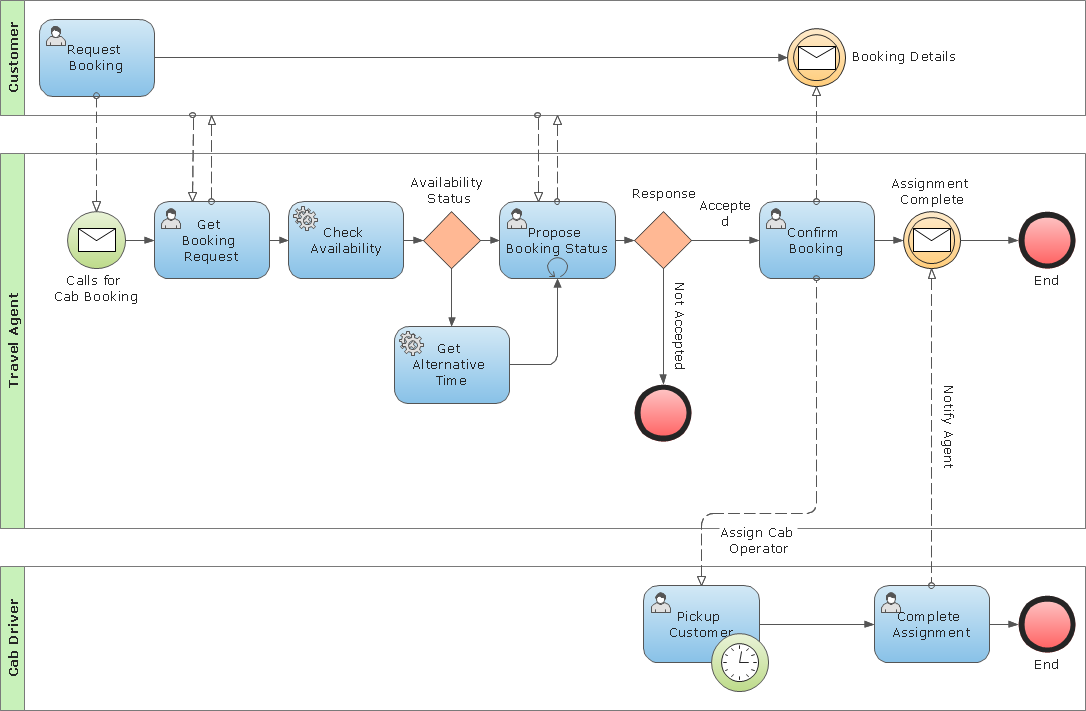
Create business process diagrams (BPMN 2.0.) with ConceptDraw using professional looking templates. ConceptDraw is business process improvement tools.

Business Processes

The most worked out and commonly used methodology of business processes description is IDEF methodology. Besides business processes it allows to describe functional blocks, for example production and marketing. ConceptDraw lets creation of business processes description using IDEF0 and IDEF2 methods.

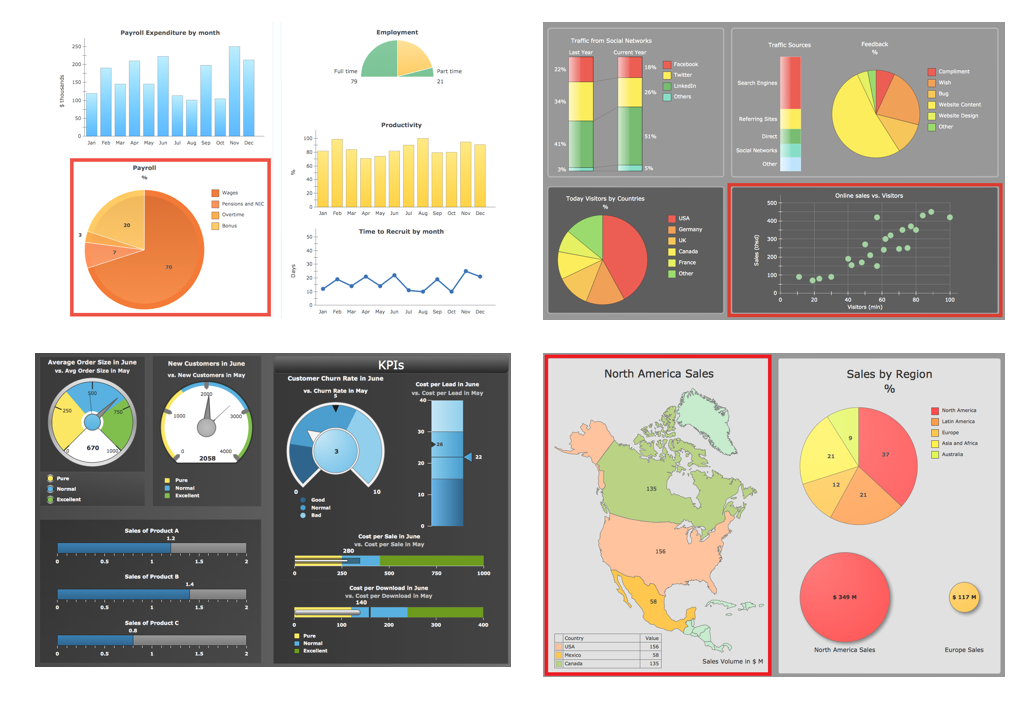
Making Dashboards Useful Again. Part 0.

Have you ever used dashboards? You probably have, and not just once. Speedometer, tachometer, fuel and oil level indicators, clock, and GPS – this is a typical set of instrumentation that can be found on a car dashboard. Even though all of these indicators are present, an experienced driver feels the speed and engine rpm with sufficient accuracy without looking at the dashboard consistently. The dashboard is an important tool in the car, but not necessarily an irreplaceable one: we need all these indicators to be available while driving, but for 99% of the time they are superfluous.

Purchase Process Flow Chart, Receiving Process Flow Chart, Accounting Flowchart Example.

The purchasing process follows very specific guidelines and includes a purchasing cycle flowchart and receiving process flow chart. Common key elements of purchasing process.
It is important to know how purchasing processes work and how each operation is done.

Data Flow Diagram

Data flow diagram (DFD) is the part of the SSADM method (Structured Systems Analysis and Design Methodology), intended for analysis and information systems projection. Data flow diagrams are intended for graphical representation of data flows in the information system and for analysis of data processing during the structural projection. Data flow diagram often used in connection with human process and can be displayed as workflow diagram. The critical Process Flow Diagram is another flowchart technique for designing data flow in connection with organizational processes. The critical Process flow diagram may use different range of symbols than a classic workflow diagram.