"A patent ... is a set of exclusive rights granted by a sovereign state to an inventor or assignee for a limited period of time in exchange for detailed public disclosure of an invention. An invention is a solution to a specific technological problem and is a product or a process. Patents are a form of intellectual property.
The procedure for granting patents, requirements placed on the patentee, and the extent of the exclusive rights vary widely between countries according to national laws and international agreements. Typically, however, a granted patent application must include one or more claims that define the invention. A patent may include many claims, each of which defines a specific property right. These claims must meet relevant patentability requirements, such as novelty and non-obviousness. The exclusive right granted to a patentee in most countries is the right to prevent others from making, using, selling, importing, or distributing a patented invention without permission.
Under the World Trade Organization's (WTO) Agreement on Trade-Related Aspects of Intellectual Property Rights, patents should be available in WTO member states for any invention, in all fields of technology, and the term of protection available should be a minimum of twenty years. Nevertheless, there are variations on what is patentable subject matter from country to country." [Patent. Wikipedia]
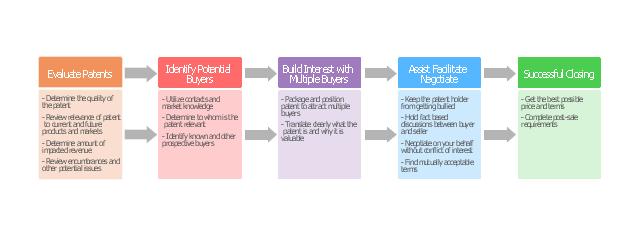
The step chart example "Selling technology patent process" was created using the ConceptDraw PRO diagramming and vector drawing software extended with the Block Diagrams solution from the area "What is a Diagram" of ConceptDraw Solution Park.
The procedure for granting patents, requirements placed on the patentee, and the extent of the exclusive rights vary widely between countries according to national laws and international agreements. Typically, however, a granted patent application must include one or more claims that define the invention. A patent may include many claims, each of which defines a specific property right. These claims must meet relevant patentability requirements, such as novelty and non-obviousness. The exclusive right granted to a patentee in most countries is the right to prevent others from making, using, selling, importing, or distributing a patented invention without permission.
Under the World Trade Organization's (WTO) Agreement on Trade-Related Aspects of Intellectual Property Rights, patents should be available in WTO member states for any invention, in all fields of technology, and the term of protection available should be a minimum of twenty years. Nevertheless, there are variations on what is patentable subject matter from country to country." [Patent. Wikipedia]
The step chart example "Selling technology patent process" was created using the ConceptDraw PRO diagramming and vector drawing software extended with the Block Diagrams solution from the area "What is a Diagram" of ConceptDraw Solution Park.
Step chart
SSADM Diagram

Electrical Symbols, Electrical Diagram Symbols

Jacobson Use Cases Diagram

Bubble diagrams with ConceptDraw DIAGRAM

 SYSML
SYSML
The SysML solution helps to present diagrams using Systems Modeling Language; a perfect tool for system engineering.
 Target and Circular Diagrams
This solution extends ConceptDraw DIAGRAM software with samples, templates and library of design elements for drawing the Target and Circular Diagrams.
Flow Chart Creator

 Business Process Mapping
The Business Process Mapping solution for ConceptDraw DIAGRAM is for users involved in process mapping and creating SIPOC diagrams.
ConceptDraw Arrows10 Technology

HelpDesk
How to Draw a Line Chart Quickly

Basic Diagramming


Use the Best FlowChart Tool for the Job

Technical Flow Chart Example

- Import process - Flowchart | Block diagram - Selling technology ...
- International Trade Block Diagram
- Trading process diagram - Deployment flowchart | Target Diagram ...
- SSADM Diagram | Target Diagram | Block diagram - Selling ...
- Process Flowchart | Trading process diagram - Deployment ...
- Role Of Import And Export Trade Block Diagrams
- Financial Trade UML Use Case Diagram Example | UML Block ...
- Block Trade Flow Chart
- Sales Process Flowchart. Flowchart Examples | Block diagram ...
- Foreign trade - Onion diagram | Target Diagram | Target and ...
- UML Tool & UML Diagram Examples | Diagrams Of Aid To Trade
- Diagram Of Aid To Trade
- Block diagram - Selling technology patent process | Top 5 Android ...
- Trading process diagram - Deployment flowchart | SSADM Diagram ...
- Business Mapping Software | What Is A Diagram Of Aid To Trade
- Diagram For Trade Cycle For Whole Sale
- Flow chart Example. Warehouse Flowchart | Block diagram - Selling ...
- Basic Diagramming | Block diagram - Types of individual behavior in ...
- Trading process diagram - Deployment flowchart | Create Response ...
- UML Class Diagram Generalization Example UML Diagrams | UML ...