"A patent ... is a set of exclusive rights granted by a sovereign state to an inventor or assignee for a limited period of time in exchange for detailed public disclosure of an invention. An invention is a solution to a specific technological problem and is a product or a process. Patents are a form of intellectual property.
The procedure for granting patents, requirements placed on the patentee, and the extent of the exclusive rights vary widely between countries according to national laws and international agreements. Typically, however, a granted patent application must include one or more claims that define the invention. A patent may include many claims, each of which defines a specific property right. These claims must meet relevant patentability requirements, such as novelty and non-obviousness. The exclusive right granted to a patentee in most countries is the right to prevent others from making, using, selling, importing, or distributing a patented invention without permission.
Under the World Trade Organization's (WTO) Agreement on Trade-Related Aspects of Intellectual Property Rights, patents should be available in WTO member states for any invention, in all fields of technology, and the term of protection available should be a minimum of twenty years. Nevertheless, there are variations on what is patentable subject matter from country to country." [Patent. Wikipedia]
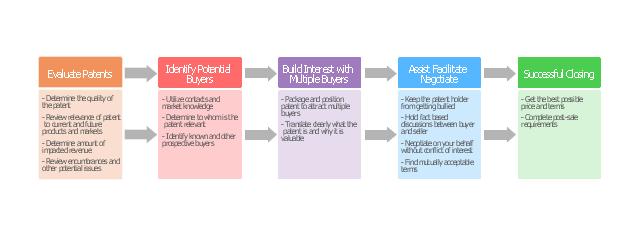
The step chart example "Selling technology patent process" was created using the ConceptDraw PRO diagramming and vector drawing software extended with the Block Diagrams solution from the area "What is a Diagram" of ConceptDraw Solution Park.
The procedure for granting patents, requirements placed on the patentee, and the extent of the exclusive rights vary widely between countries according to national laws and international agreements. Typically, however, a granted patent application must include one or more claims that define the invention. A patent may include many claims, each of which defines a specific property right. These claims must meet relevant patentability requirements, such as novelty and non-obviousness. The exclusive right granted to a patentee in most countries is the right to prevent others from making, using, selling, importing, or distributing a patented invention without permission.
Under the World Trade Organization's (WTO) Agreement on Trade-Related Aspects of Intellectual Property Rights, patents should be available in WTO member states for any invention, in all fields of technology, and the term of protection available should be a minimum of twenty years. Nevertheless, there are variations on what is patentable subject matter from country to country." [Patent. Wikipedia]
The step chart example "Selling technology patent process" was created using the ConceptDraw PRO diagramming and vector drawing software extended with the Block Diagrams solution from the area "What is a Diagram" of ConceptDraw Solution Park.
Step chart
 Flowcharts
The Flowcharts solution for ConceptDraw DIAGRAM is a comprehensive set of examples and samples in several varied color themes for professionals that need to represent graphically a process. Solution value is added by the basic flow chart template and shapes' libraries of flowchart notation. ConceptDraw DIAGRAM flow chart creator lets one depict the processes of any complexity and length, as well as design the Flowchart either vertically or horizontally.
 Transport Hazard Pictograms
Transport Hazard Pictograms solution includes large variety of specially developed samples with transport hazard symbols and pictograms, and the whole set of predesigned vector transport GHS pictograms download and used with ease from the Transport Hazard Pictograms library. Apply them for quick designing professional-looking infographics and diagrams, use them to create warning signboards and announcements on all stages of the transportation process, to place them on the transport vehicles and warehouses of transportation companies, at the transport documentation and on the websites of transport and logistics companies.
IDEF0 standard with ConceptDraw DIAGRAM

Business Diagram Software


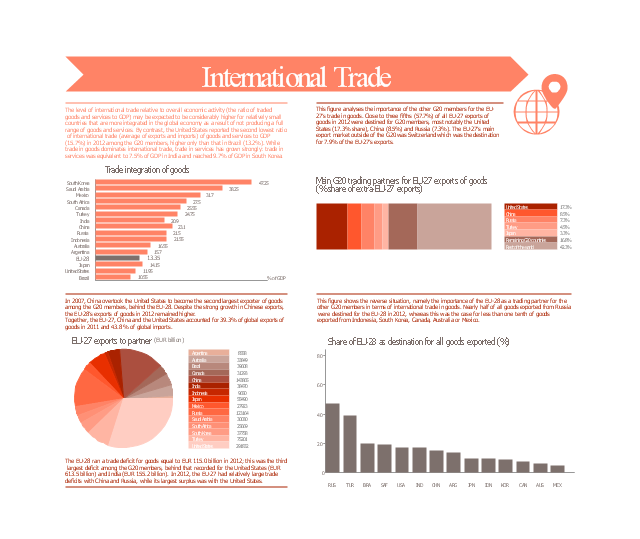
This marketing infogram example was created on the base of data of "The EU in the world 2014. A statistical portrai" from the website of the Eurostat - the statistical office of the European Union situated in Luxembourg.
"In 2007, China overtook the United States to become the second largest exporter of goods among the G20 members, behind the EU-28. Despite the strong growth in Chinese exports, the EU-28’s exports of goods in 2012 remained higher.
Together, the EU-27, China and the United States accounted for 39.3% of global exports of goods in 2011 and 43.8 % of global imports."
[epp.eurostat.ec.europa.eu/ cache/ ITY_ OFFPUB/ KS-EX-14-001/ EN/ KS-EX-14-001-EN.PDF]
The marketing infographic example "International trade statistics - EU in comparison with the Group of Twenty" was created using the ConceptDraw PRO diagramming and vector drawing software extended with the Marketing Infographics solition from the area "Business Infographics" in ConceptDraw Solution Park.
Marketing infogram
 Marketing Diagrams
Marketing Diagrams solution extends ConceptDraw DIAGRAM diagramming software with abundance of samples, templates and vector design elements intended for easy graphical visualization and drawing different types of Marketing diagrams and graphs, including Branding Strategies Diagram, Five Forces Model Diagram, Decision Tree Diagram, Puzzle Diagram, Step Diagram, Process Chart, Strategy Map, Funnel Diagram, Value Chain Diagram, Ladder of Customer Loyalty Diagram, Leaky Bucket Diagram, Promotional Mix Diagram, Service-Goods Continuum Diagram, Six Markets Model Diagram, Sources of Customer Satisfaction Diagram, etc. Analyze effectively the marketing activity of your company and apply the optimal marketing methods with ConceptDraw DIAGRAM software.
Horizontal Orgchart

- Diagram International Trade Process
- Foreign trade - Onion diagram | Target Diagram | Target and ...
- Flow Chart Of International Trade
- International Trade Process Flow
- Flow Chart Of Foreign Trade Showing Import And Export
- Uml Diagram For Foreign Export And Import
- Diagram Of Import Trade
- Process flowchart - Trading process | Settlement Process Flowchart ...
- Showing International Trade In A Diagram
- Import process - Flowchart | Import Export Process Flow Chart