 Business Intelligence Dashboard
Business Intelligence Dashboard solution extends the ConceptDraw PRO v11 functionality with exclusive tools, numerous ready-to-use vector objects, samples and quick-start templates for creation professional Business Intelligence Dashboards, Business Intelligence Graphics, Business Intelligence Charts and Maps of different kinds. Design easy the BI dashboard, BI model or Dynamic chart in ConceptDraw PRO to monitor the company's work, to track the indicators corresponding your company's data, to display and analyze key performance indicators, to evaluate the trends and regularities of the processes occurring at the company.
HelpDesk
How to Make Business Intelligence Dashboard

Business Intelligence Dashboard Software

Sales Dashboard - Access Anywhere
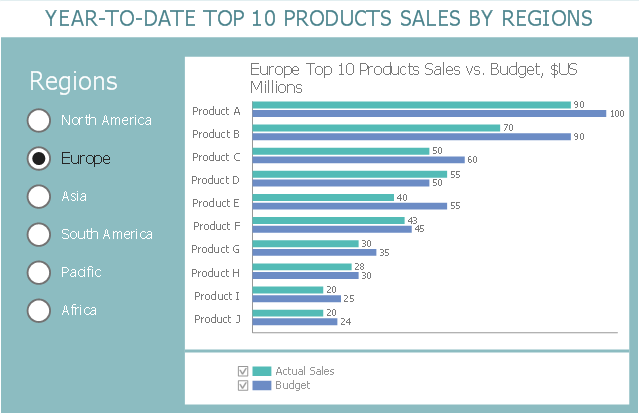
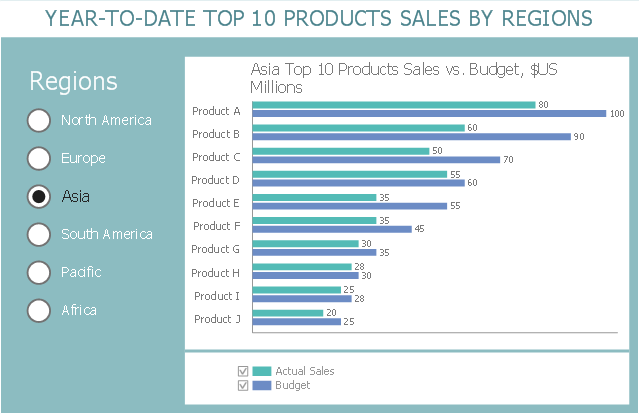
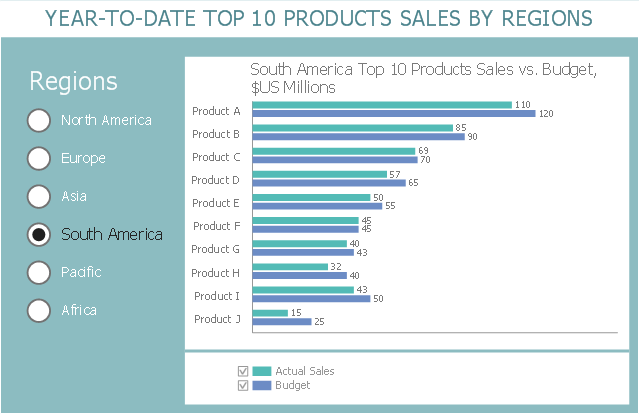
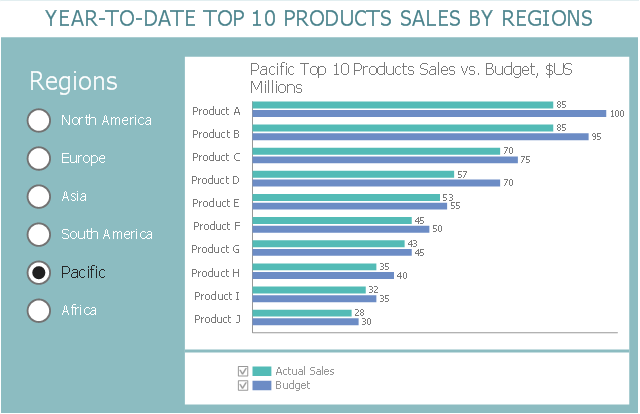
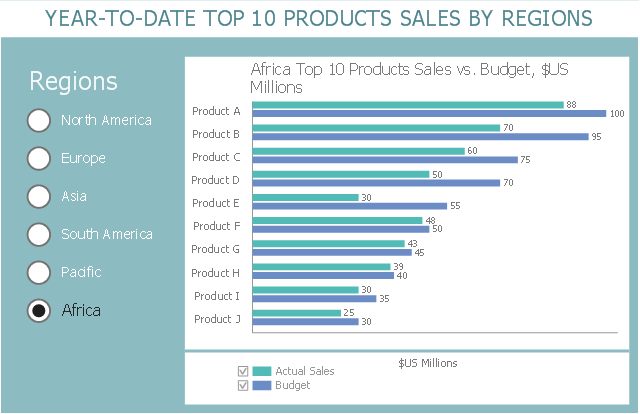
This business intelligence dashboard sample shows the year-to-date top 10 products sales by regions using horizontal bar charts.
"Dashboards often provide at-a-glance views of KPIs (key performance indicators) relevant to a particular objective or business process (e.g. sales, marketing, human resources, or production). In real-world terms, "dashboard" is another name for "progress report" or "report."" [Dashboard (business). Wikipedia]
The BI dashboard example "Year-to-date Top 10 Products Sales by Regions" was created using ConceptDraw PRO software extended with the Business Intelligence Dashboards solution from the Business Processes area of ConceptDraw Solution Park.
North America

Europe
Asia
South America
Pacific
Africa
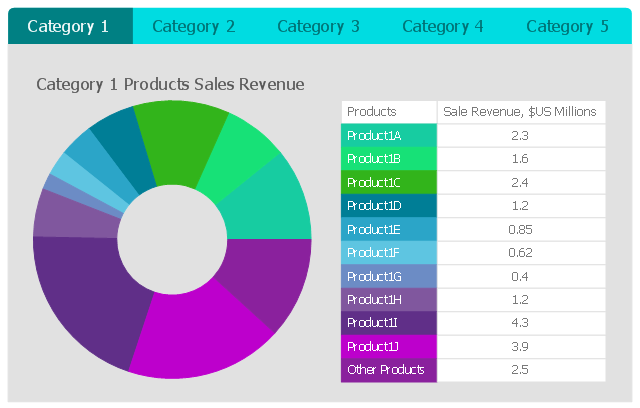
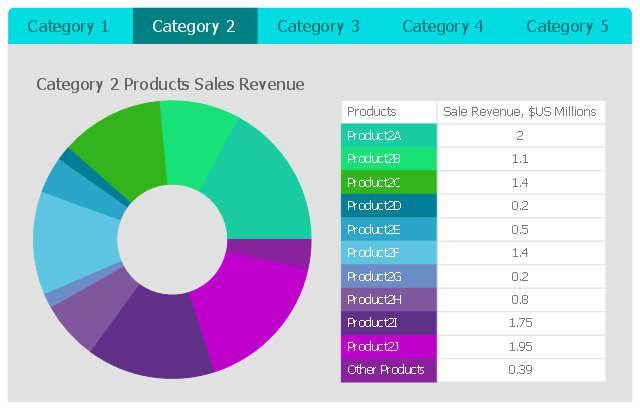
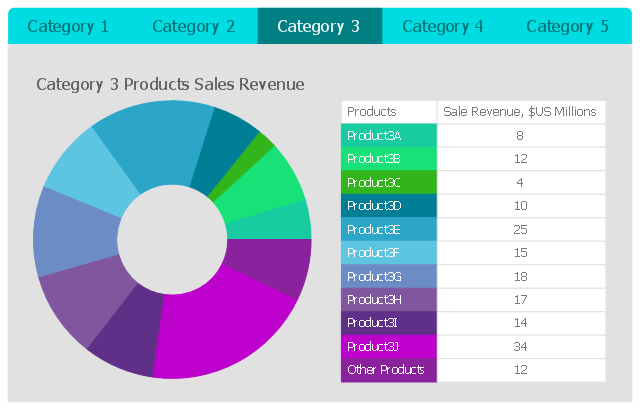
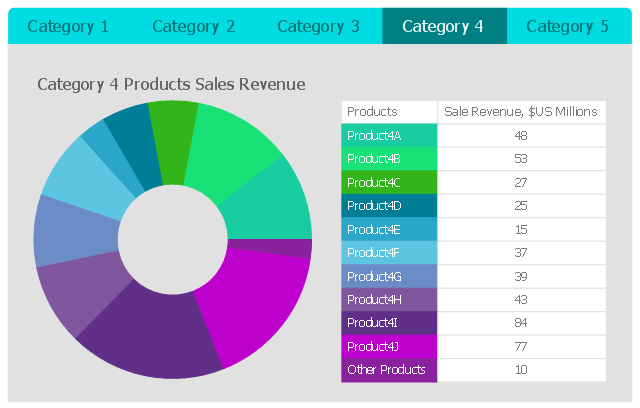
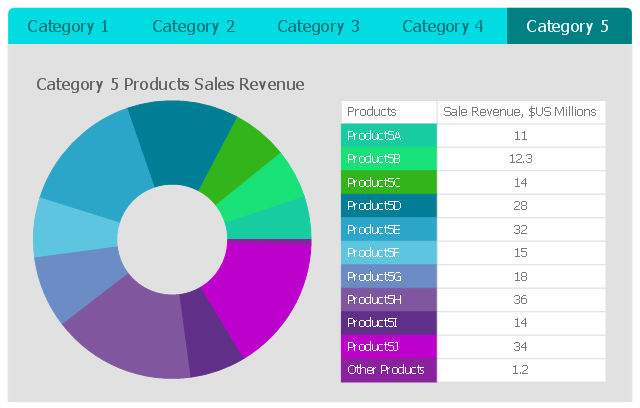
This business intelligence dashboard sample shows the quarter sales revenue for top 10 products by categories using donut charts.
"A doughnut chart (also spelled donut) is a variant of the pie chart, with a blank center allowing for additional information about the data as a whole to be included." [Pie chart. Wikipedia]
The BI dashboard example "Quarter Sales Revenue for Top 10 Products by Categories" was created using ConceptDraw PRO software extended with the Business Intelligence Dashboards solution from the Business Processes area of ConceptDraw Solution Park.
Category 1
Category 2
Category 3
Category 4
Category 5
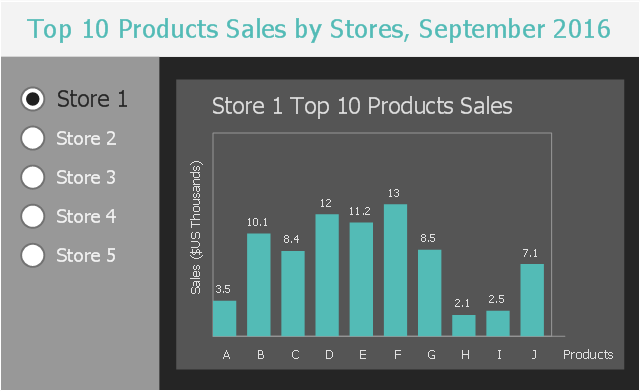
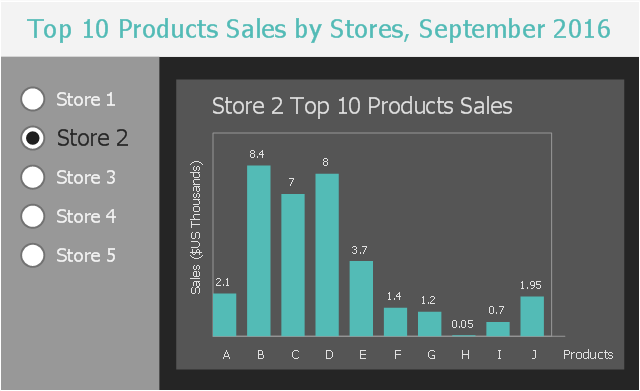
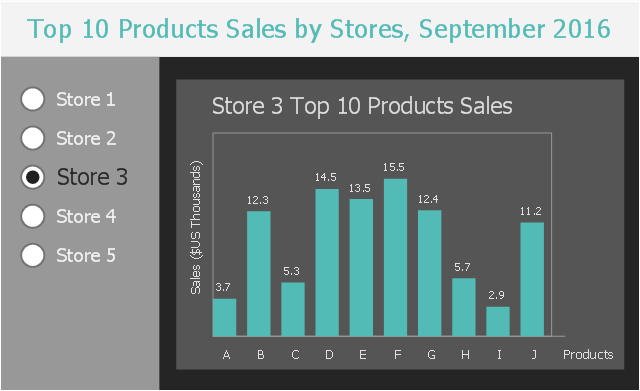
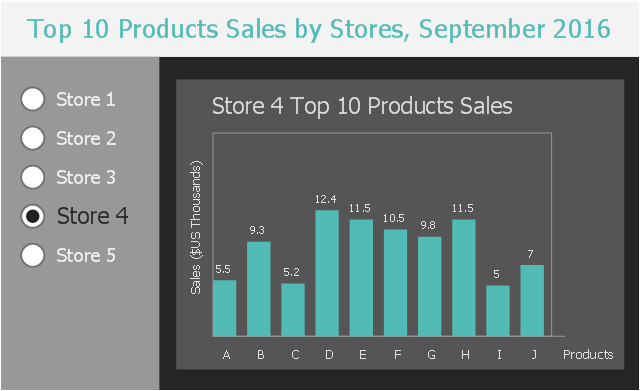
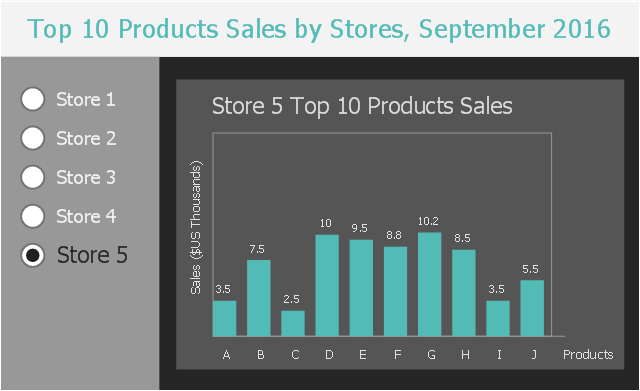
This business intelligence dashboard sample shows the top 10 products sales by stores in September, 2016 using vertical bar charts.
"Bar graphs/ charts provide a visual presentation of categorical data. Categorical data is a grouping of data into discrete groups, such as months of the year, age group, shoe sizes, and animals. These categories are usually qualitative. In a column bar chart, the categories appear along the horizontal axis; the height of the bar corresponds to the value of each category." [Bar chart. Wikipedia]
The BI dashboard example "Top 10 Products Sales by Stores, September 2016" was created using ConceptDraw PRO software extended with the Business Intelligence Dashboards solution from the Business Processes area of ConceptDraw Solution Park.
Store 1
Store 2
Store 3
Store 4
Store 5
 AWS Architecture Diagrams
The flexible AWS cloud solutions will help you to create reliable applications with a high level of scaling in the AWS cloud, to run your applications and accelerate their work on the level of security. Besides AWS resources are available worldwide and yo
 Enterprise Architecture Diagrams
Enterprise Architecture Diagrams solution extends ConceptDraw PRO software with templates, samples and library of vector stencils for drawing the diagrams of enterprise architecture models.
 Education Package
Education Package is a comprehensive set of multifarious graphical solutions from ConceptDraw Solution Park, collected together in help to ConceptDraw PRO users working in a field of science, education and training, which is aimed at improving the quality of education and helping to design with ease variety of interesting and colorful educational materials, diagrams, charts and maps. Use it to present the information and knowledge in an interesting, clear, structured and simple form to achieve a success in education and pedagogy, to maintain the interest of students and pupils throughout the whole learning process, at the lectures, lessons and even during independent work with additional materials, to contribute to better perception of scientific information by listeners during the conferences and reports.
 School and Training Plans
Planning a school and its campus layout needs to depict the premises, represent internal spaces, location of windows and direction of natural light. Detailed classroom seating chart helps you visualize location of the blackboard and desks, taking into account the specifics of the room and its lighting, with a goal to design the classroom to be comfortable for each pupil and teacher.
 Security and Access Plans
This solution extends ConceptDraw PRO software with physical security plan, security chart, access chart, security plans, access schemes, access plans , CCTV System Plan samples, templates and libraries of design elements for drawing the Security and Acce
 Basic Circular Arrows Diagrams
This solution extends ConceptDraw PRO v10 (or later) with samples, templates, and a library of vector stencils for drawing circular arrow diagrams.
 Floor Plans
Construction, repair and remodeling of the home, flat, office, or any other building or premise begins with the development of detailed building plan and floor plans. Correct and quick visualization of the building ideas is important for further construction of any building.
- Business Intelligence Dashboard | How to Make Business ...
- Sales Dashboard Template | Business Intelligence Dashboard ...
- KPIs and Metrics | Business Intelligence Dashboard | Competitor ...
- Business Intelligence Dashboard Software | Sales Dashboard ...
- Design elements - Sales dashboard | Business Intelligence ...
- Business Intelligence Dashboard | Process Flowchart | Basic ...
- KPI Dashboard | Business Intelligence Dashboard | Meter ...
- New Business Intelligence Dashboard Solution for ConceptDraw PRO
- Business Graphics Software | KPI Dashboard | Business Intelligence ...
- Business Intelligence Dashboard Software | Sale dashboard | Sales ...
- Enterprise dashboard | Business Intelligence Dashboard | Meter ...
- Enterprise dashboard | KPI Dashboard | Business Intelligence ...
- Meter Dashboard | Business Intelligence Dashboard | Interactive ...
- Business Intelligence Dashboard | Fault Tree Analysis Diagrams ...
- Business Intelligence Dashboard | Sales Dashboard | How to Create ...
- Business Intelligence Dashboard | Year-to-date Top 10 Products ...
- Business Intelligence Dashboard | Data Visualization Software ...
- Business Intelligence Dashboard | Correlation Dashboard | Sales ...
- KPIs and Metrics | Business Intelligence Dashboard | Website ...
- Business Intelligence Dashboard | Composition Dashboard | How to ...