 Business Intelligence Dashboard
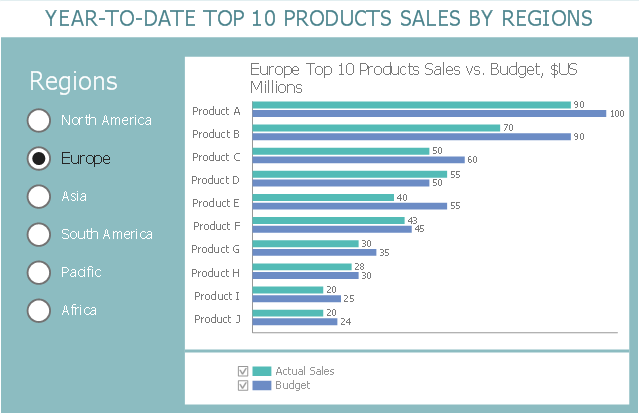
Business Intelligence Dashboard solution extends the ConceptDraw PRO v11 functionality with exclusive tools, numerous ready-to-use vector objects, samples and quick-start templates for creation professional Business Intelligence Dashboards, Business Intelligence Graphics, Business Intelligence Charts and Maps of different kinds. Design easy the BI dashboard, BI model or Dynamic chart in ConceptDraw PRO to monitor the company's work, to track the indicators corresponding your company's data, to display and analyze key performance indicators, to evaluate the trends and regularities of the processes occurring at the company.
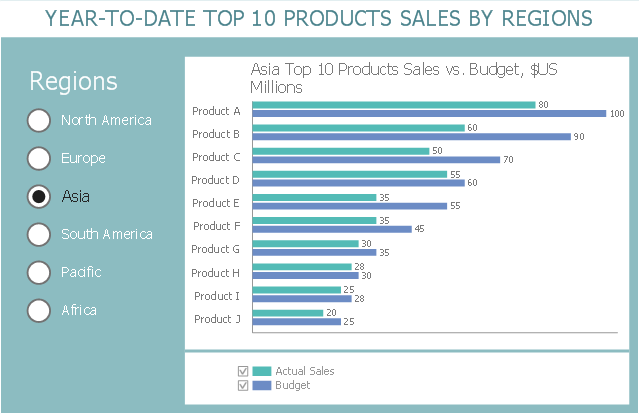
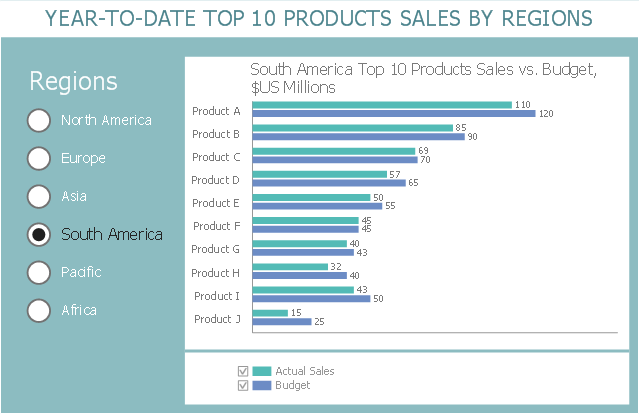
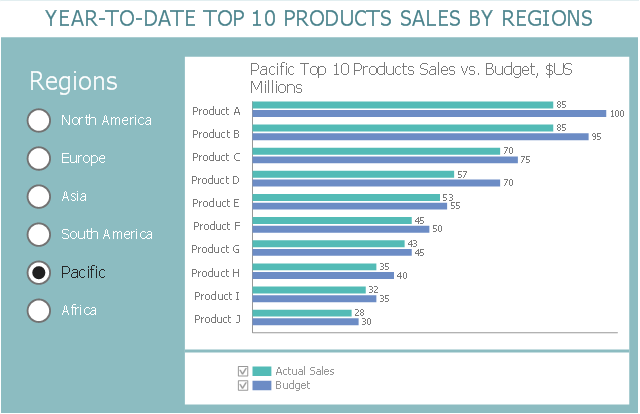
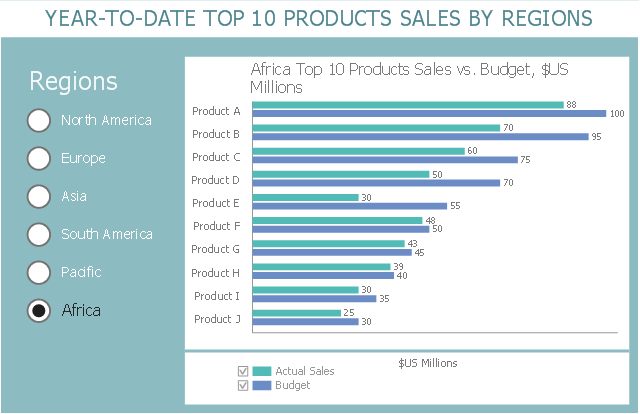
This business intelligence dashboard sample shows the year-to-date top 10 products sales by regions using horizontal bar charts.
"Dashboards often provide at-a-glance views of KPIs (key performance indicators) relevant to a particular objective or business process (e.g. sales, marketing, human resources, or production). In real-world terms, "dashboard" is another name for "progress report" or "report."" [Dashboard (business). Wikipedia]
The BI dashboard example "Year-to-date Top 10 Products Sales by Regions" was created using ConceptDraw PRO software extended with the Business Intelligence Dashboards solution from the Business Processes area of ConceptDraw Solution Park.
North America

Europe
Asia
South America
Pacific
Africa
 Business Process Mapping
The Business Process Mapping solution for ConceptDraw PRO is for users involved in process mapping and creating SIPOC diagrams.
 Business Process Model and Notation
Business Process Model and Notation Solution for ConceptDraw PRO is helpful for modeling the business processes of any degree of complexity, documenting them and effective creating diagrams using the BPMN 2.0 standard.
 Fishbone Diagrams
The Fishbone Diagrams solution extends ConceptDraw PRO v10 software with the ability to easily draw the Fishbone Diagrams (Ishikawa Diagrams) to clearly see the cause and effect analysis and also problem solving. The vector graphic diagrams produced using this solution can be used in whitepapers, presentations, datasheets, posters, and published technical material.
- PM Dashboards | Business Intelligence Dashboard | Meter ...
- Enterprise dashboard | KPI Dashboard | Business Intelligence ...
- KPI Dashboard | Business Intelligence Dashboard | Meter ...
- Hr Productivity Performance Dashboard
- Hr Performance Dashboard Layout
- Business Intelligence Dashboard | HR Flowcharts | ConceptDraw ...
- Enterprise dashboard | KPI Dashboard | HR Flowcharts | Human ...
- Enterprise dashboard | BPR Diagram. Business Process ...
- HR Flowcharts | PM Dashboards | ConceptDraw Solution Park | Hr ...
- Hr Information System Dashboard
- Enterprise dashboard | Business Intelligence Dashboard | Meter ...
- Basic Flowchart Symbols and Meaning | Status Dashboard | Meter ...
- HR Flowcharts | Human Resource Development | Human Resource ...
- Enterprise dashboard | Business Intelligence Dashboard | Meter ...
- Dashboard Kpi Human Resources
- Hr Dashboard Manufacturing
- Performance Indicators | What is a KPI? | KPI Dashboard | Key ...
- Enterprise dashboard | Business Intelligence Dashboard | Design ...
- Frequency Distribution Dashboard | Time Series Dashboard | HR ...
- Performance Indicators | PM Dashboards | Design elements - Sales ...