This site uses cookies. By continuing to browse the ConceptDraw site you are agreeing to our Use of Site Cookies.

The Best Mac Software for Diagramming or Drawing

ConceptDraw DIAGRAM is a powerful intelligent vector graphics engine that can be used to create basic diagrams including flowcharts, charts, workflows, flowcharts, organizational charts, business diagram, learn business diagrams, flow diagrams.
How to draw an Organizational Chart

The Best Flowchart Software Available

ConceptDraw gives the ability to draw Flowchart documents. Flowcharts solutionis a powerful tool that extends ConceptDraw application for drawing business flowcharts.
ConceptDraw DIAGRAM vector diagramming and business graphics software enhanced with with templates, green and interactive flowchart makers, samples and stencil libraries from ConceptDraw Solution Park which all focused to help with drawing flowcharts, block diagrams, bar charts, histograms, pie charts, divided bar diagrams, line graphs, area charts, scatter plots, circular arrows diagrams, Venn diagrams, bubble diagrams, concept maps, and others.

Diagram Software - The Best Choice for Diagramming

For vector shapes and connector tools for quick and easy drawing diagrams for business, technology, science and education - The best choice for Diagramming is ConceptDraw DIAGRAM.

Use the Best FlowChart Tool for the Job

The ConceptDraw DIAGRAM is a best flow chart tool for the job. The samples and templates included in the basic set allows users to draw any type of a flowchart. The vector stencils created by designers give ability to draw great-looking flowchart. Flowcharts give to users the ability to represent structural data visually.

Best Program to Create a Fowchart

ConceptDraw - feature-rich flowchart software allows you create professional looking flowcharts.

Data Flow Diagram Symbols. DFD Library

Data Flow Diagrams show information transfers and process steps of a system. The general concept is an approach of a depicting how occurs input in a system, further processes and what runs out. The aim of DFD is in accomplishing of understanding between developers and users. Data flow diagrams are maintained with other methods of structured systems analysis.

BCG Matrix

The growth–share matrix (BCG Matrix) was created by Bruce D. Henderson for the Boston Consulting Group in 1970 to help corporations to analyze their business units and to help the company allocate resources. How is it easy design the BCG Matrices in ConceptDraw DIAGRAM diagramming and vector drawing software supplied with unique Matrices Solution from the Marketing Area of ConceptDraw Solution Park.

process mapping, sipoc diagram, swim lanes, business mapping software Business Process Mapping

process mapping, sipoc diagram, swim lanes, business mapping software
The Business Process Mapping solution for ConceptDraw DIAGRAM is for users involved in process mapping and creating SIPOC diagrams.

Fundraising Pyramid

ConceptDraw Pyramid Diagram software allows drawing column charts using predesigned objects or drawing tool.

Draw Company Structure with Organization Charting Software

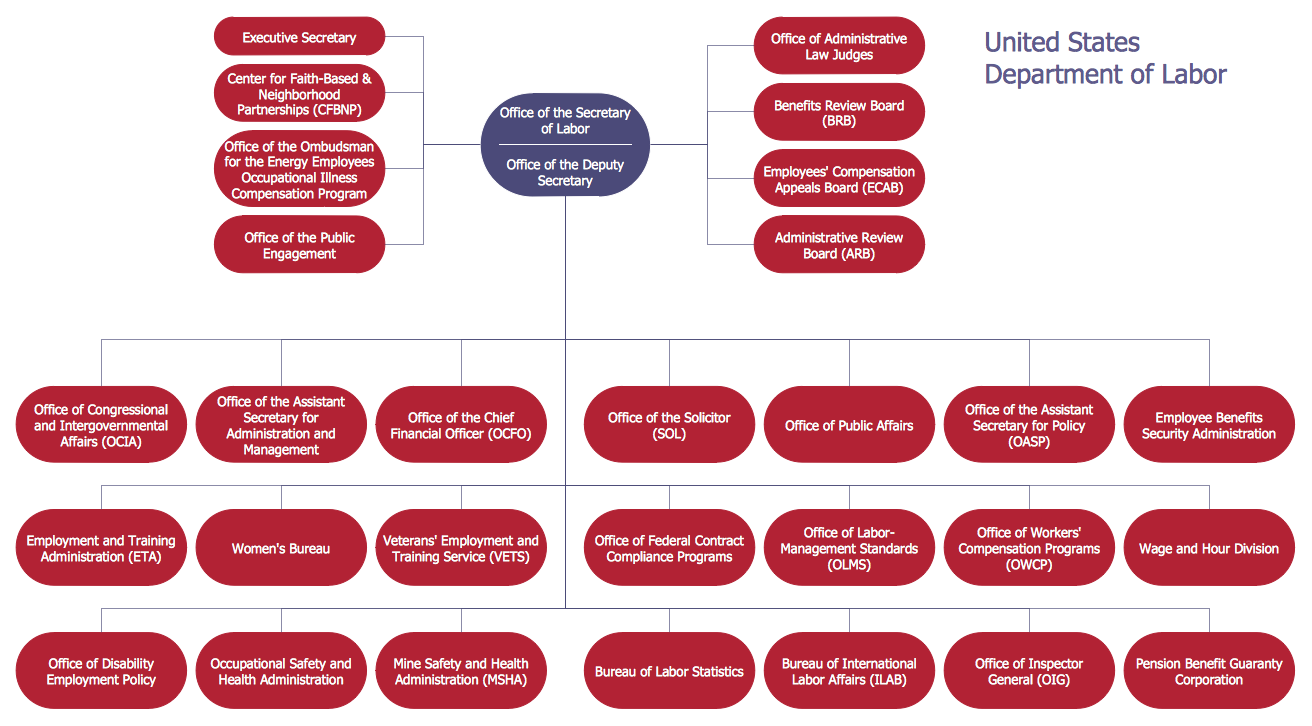
Draw Company Structure Diagram - get the detailed information about the company structure and hierarchy - who execute what tasks and who is in charge at this company. This information shows the reasoning and success of business and is indispensable for investors and financial institutions.