, t chart, decision matrix, decision tree analysis") Decision Making
Decision Making
The Decision Making solution offers the set of professionally developed examples, powerful drawing tools and a wide range of libraries with specific ready-made vector decision icons, decision pictograms, decision flowchart elements, decision tree icons, decision signs arrows, and callouts, allowing the decision maker (even without drawing and design skills) to easily construct Decision diagrams, Business decision maps, Decision flowcharts, Decision trees, Decision matrix, T Chart, Influence diagrams, which are powerful in questions of decision making, holding decision tree analysis and Analytic Hierarchy Process (AHP), visual decomposition the decision problem into hierarchy of easily comprehensible sub-problems and solving them without any efforts.
Decision Tree Analysis
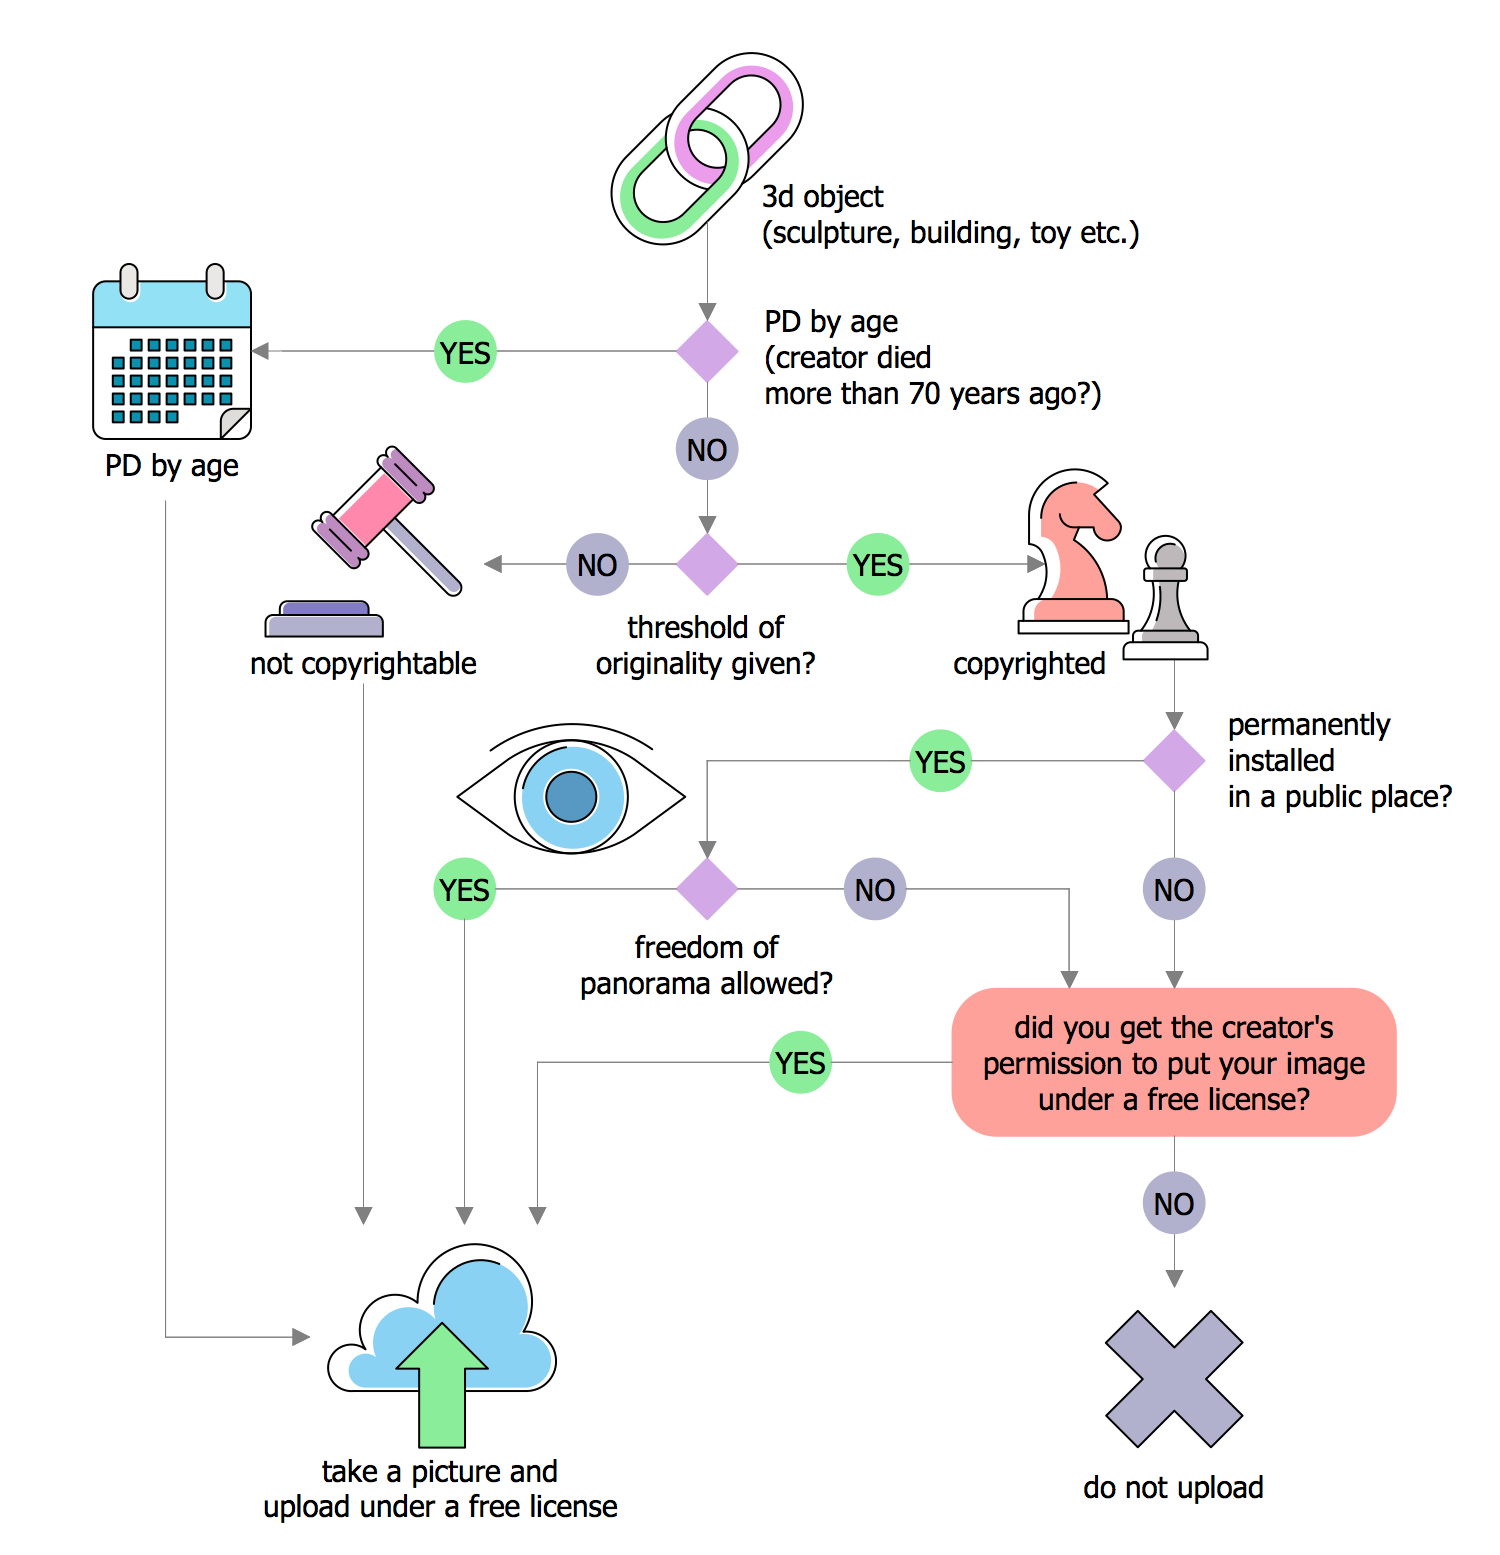
The ConceptDraw DIAGRAM diagramming and drawing software is the one that can help with creating the needed drawing, including a decision tree. Making decision tree analysis, it is always easy to make the needed matrix as there are plenty of pre-made templates to be used.
Influence Diagram Software

The Best Flowchart Software Available


Fault Tree Analysis Software
Marketing Charts
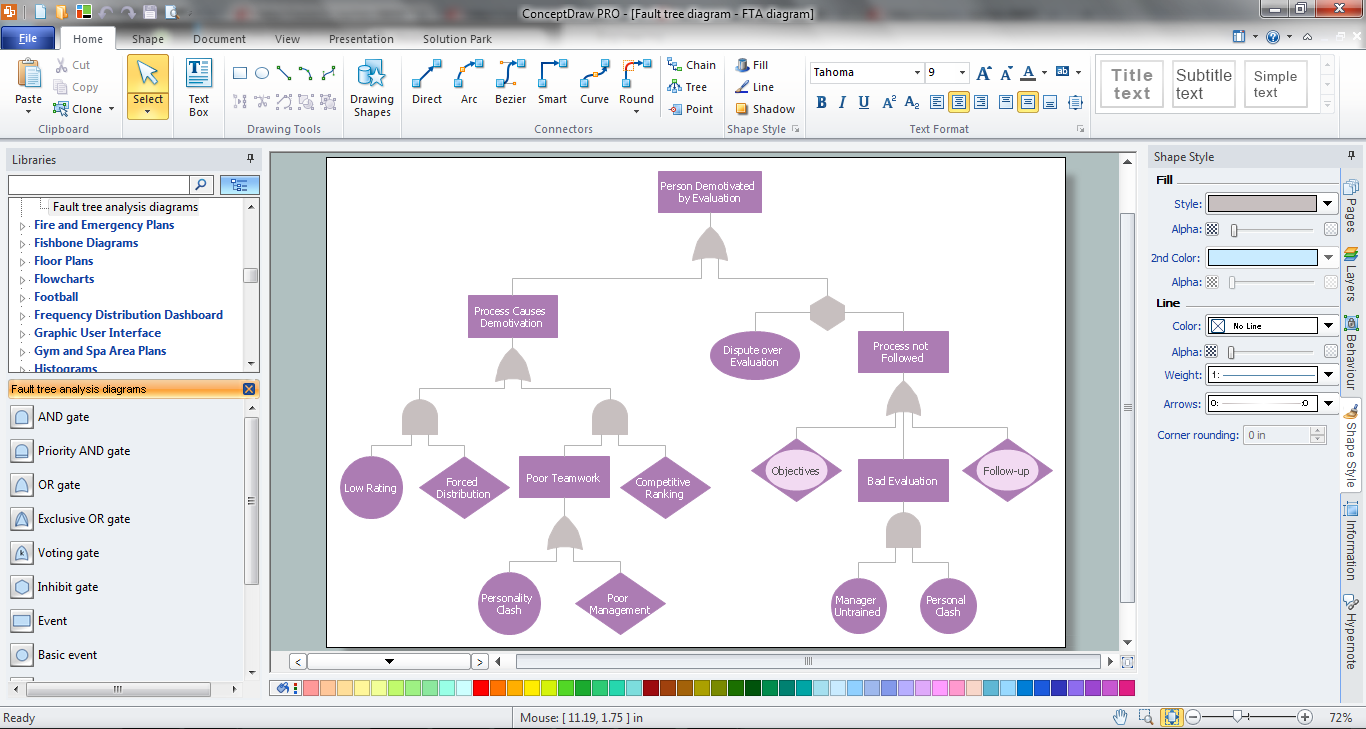
 Fault Tree Analysis Diagrams
This solution extends ConceptDraw DIAGRAM.5 or later with templates, fault tree analysis example, samples and a library of vector design elements for drawing FTA diagrams (or negative analytical trees), cause and effect diagrams and fault tree diagrams.
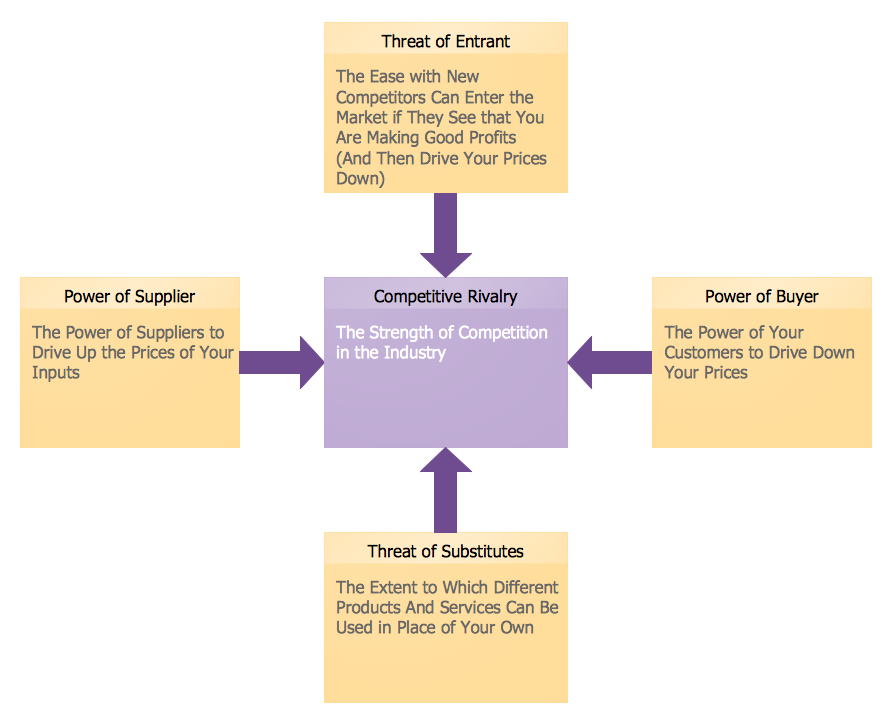
 Marketing Diagrams
Marketing Diagrams solution extends ConceptDraw DIAGRAM diagramming software with abundance of samples, templates and vector design elements intended for easy graphical visualization and drawing different types of Marketing diagrams and graphs, including Branding Strategies Diagram, Five Forces Model Diagram, Decision Tree Diagram, Puzzle Diagram, Step Diagram, Process Chart, Strategy Map, Funnel Diagram, Value Chain Diagram, Ladder of Customer Loyalty Diagram, Leaky Bucket Diagram, Promotional Mix Diagram, Service-Goods Continuum Diagram, Six Markets Model Diagram, Sources of Customer Satisfaction Diagram, etc. Analyze effectively the marketing activity of your company and apply the optimal marketing methods with ConceptDraw DIAGRAM software.
Best Flowcharts

- Top 5 Android Flow Chart Apps | Free Decision Tree Maker
- Free Decision Tree Software Or Template
- Decision Tree Software Free Mac
- Decision Tree Flowchart
- Free Decision Tree Tool
- Decision Tree Excel Template Download
- Free Online Decision Tree Maker
- Decision Tree Templates For Free
- Decision Tree Template Visio
- Cause and Effect Analysis | Influence Diagram Software | Decision ...