Process Flowchart


Entity Relationship Diagram Symbols

Basic Flowchart Symbols and Meaning


Cross-Functional Flowchart


Funnel Diagram

In order to make a funnel diagram, the Funnel Diagrams solution can be used while working in the ConceptDraw PRO diagramming and drawing software. Having the pre-made design elements as well as the examples of funnel diagrams, the Funnel Diagrams solution allows any ConceptDraw PRO user to make their own unique as well as professionally-looking drawings.
Rainfall Bar Chart

Network Diagram Software LAN Network Diagrams & Diagrams for LAN Physical Office Network Diagrams


UML Class Diagram Generalization Example UML Diagrams

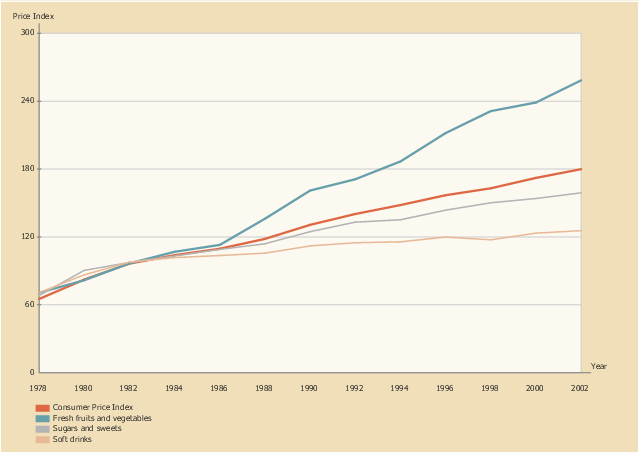
This line graph sample shows the relative price changes for fresh fruits and vegetables, sugars and sweets, and soft drinks, using the period 1982–84 as the baseline (index = 100), 1978–2002. It was designed on the base of line chart from the website of the U.S. National Center for Chronic Disease Prevention and Health Promotion.
"The number of overweight and obese youth has increased in recent decades, yet few data assess how the lives of children have changed during the “obesity epidemic.” ...
Eating as a primary activity declined, suggesting a shift toward snacking or eating as a secondary activity. Statistically significant trends exist for carbohydrate intake, especially for chips/ crackers/ popcorn/ pretzels (intake tripled from the mid-1970s to the mid-1990s) and soft drinks (intake doubled during the same period). Price and income data suggest possible economic reasons for these changes. The percentage of disposable income spent on food has declined continuously, and almost all of the decline has been represented by food consumed at home, yet today’s disposable income buys more calories than it has in the past. Relative prices have encouraged shifts across food types. From a baseline of 100 during 1982–84, the price index for fresh fruit and vegetables increased to 258 by 2002 (far exceeding general inflation), whereas the price index for soft drinks increased only to 126 by 2002 (below general inflation)." [cdc.gov/ pcd/ issues/ 2005/ apr/ 04_ 0039.htm]
The line chart example "Relative price changes for fresh fruits and vegetables, sugars, sweets, soft drinks" was created using the ConceptDraw PRO diagramming and vector drawing software extended with the Line Graphs solution from the Graphs and Charts area of ConceptDraw Solution Park.
Line chart
ERD Symbols and Meanings


- Schedule pie chart - Daily action plan | Chart Examples | Bar Graphs ...
- Entity Relationship Diagram Symbols | ERD Symbols and Meanings ...
- Defensive Play Diagram – Under Front | Defensive play - Under front ...
- Design elements - ERD (crow's foot notation) | Entity Relationship ...
- Relative price changes for fresh fruits and vegetables, sugars ...
- How to Draw an Area Chart in ConceptDraw PRO | Area Charts ...
- How to Set Line Jumps for Smart Connectors in ConceptDraw PRO ...
- Distance From Blue Line To Goal Line
- Line Chart Template for Word | Ice Hockey Rink Dimensions | Ice ...
- Reflected Ceiling Plan | How to Create a Reflected Ceiling Floor ...