 Cafe and Restaurant Floor Plans
Restaurants and cafes are popular places for recreation, relaxation, and are the scene for many impressions and memories, so their construction and design requires special attention. Restaurants must to be projected and constructed to be comfortable and e
How To Create Restaurant Floor Plan in Minutes


"Bars categorized by the kind of entertainment they offer include:
(1) Blues bars, specializing in the live blues style of music.
(2) Comedy Bar specializing in a stand-up comedy entertainment.
(3) Dance bars, which have a dance floor where patrons dance to recorded music.
(4) But if a dance bar has a large dance floor and hires well-known professional DJs, it is considered to be a nightclub or discothèque.
(5) Karaoke bars, with nightly karaoke as entertainment.
(6) Music bars, specializing in live music (i.e. concerts).
(7) Drag bars, which have live shows, where men dress as women and generally lip-sync to recordings of female vocal artists; often with hilarious results.
(8) Salsa bars, where patrons dance to Latin salsa music.
(9) Sports bars, where sports fans watch games on large-screen televisions.
(10) Topless bars, where topless female employees dance or serve drinks." [Bar (establishment). Wikipedia]
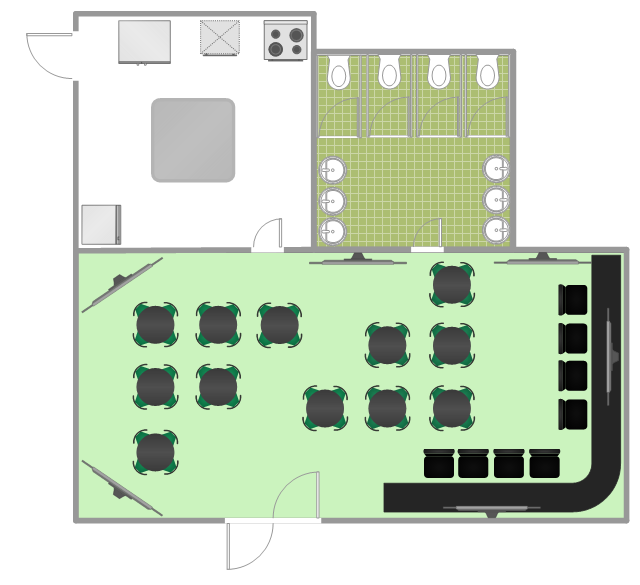
The floor plan example "Sports bar" was created using the ConceptDraw PRO diagramming and vector drawing software extended with the Cafe and Restaurant solution from the Building Plans area of ConceptDraw Solution Park.
(1) Blues bars, specializing in the live blues style of music.
(2) Comedy Bar specializing in a stand-up comedy entertainment.
(3) Dance bars, which have a dance floor where patrons dance to recorded music.
(4) But if a dance bar has a large dance floor and hires well-known professional DJs, it is considered to be a nightclub or discothèque.
(5) Karaoke bars, with nightly karaoke as entertainment.
(6) Music bars, specializing in live music (i.e. concerts).
(7) Drag bars, which have live shows, where men dress as women and generally lip-sync to recordings of female vocal artists; often with hilarious results.
(8) Salsa bars, where patrons dance to Latin salsa music.
(9) Sports bars, where sports fans watch games on large-screen televisions.
(10) Topless bars, where topless female employees dance or serve drinks." [Bar (establishment). Wikipedia]
The floor plan example "Sports bar" was created using the ConceptDraw PRO diagramming and vector drawing software extended with the Cafe and Restaurant solution from the Building Plans area of ConceptDraw Solution Park.
Floor plan
HelpDesk
How to Create a Bar Chart in ConceptDraw PRO

 Bar Graphs
The Bar Graphs solution enhances ConceptDraw PRO v10 functionality with templates, numerous professional-looking samples, and a library of vector stencils for drawing different types of Bar Graphs, such as Simple Bar Graph, Double Bar Graph, Divided Bar Graph, Horizontal Bar Graph, Vertical Bar Graph, and Column Bar Chart.
HelpDesk
How to Draw a Divided Bar Chart in ConceptDraw PRO

 Divided Bar Diagrams
The Divided Bar Diagrams Solution extends the capabilities of ConceptDraw PRO v10 with templates, samples, and a library of vector stencils for drawing high impact and professional Divided Bar Diagrams and Graphs, Bar Diagram Math, and Stacked Graph.
 Network Layout Floor Plans
Network Layout Floor Plans solution extends ConceptDraw PRO software functionality with powerful tools for quick and efficient documentation the network equipment and displaying its location on the professionally designed Network Layout Floor Plans. Never before creation of Network Layout Floor Plans, Network Communication Plans, Network Topologies Plans and Network Topology Maps was not so easy, convenient and fast as with predesigned templates, samples, examples and comprehensive set of vector design elements included to the Network Layout Floor Plans solution. All listed types of plans will be a good support for the future correct cabling and installation of network equipment.
"Bars categorized by the kind of entertainment they offer include:
(1) Blues bars, specializing in the live blues style of music.
(2) Comedy Bar specializing in a stand-up comedy entertainment.
(3) Dance bars, which have a dance floor where patrons dance to recorded music.
(4) But if a dance bar has a large dance floor and hires well-known professional DJs, it is considered to be a nightclub or discothèque.
(5) Karaoke bars, with nightly karaoke as entertainment.
(6) Music bars, specializing in live music (i.e. concerts).
(7) Drag bars, which have live shows, where men dress as women and generally lip-sync to recordings of female vocal artists; often with hilarious results.
(8) Salsa bars, where patrons dance to Latin salsa music.
(9) Sports bars, where sports fans watch games on large-screen televisions.
(10) Topless bars, where topless female employees dance or serve drinks." [Bar (establishment). Wikipedia]
The floor plan example "Sports bar" was created using the ConceptDraw PRO diagramming and vector drawing software extended with the Cafe and Restaurant solution from the Building Plans area of ConceptDraw Solution Park.
Floor plan
 Reflected Ceiling Plans
Reflected Ceiling Plans solution is effective tool for architects, designers, electricians, and other people which every day need convenient tool for representing their ceiling ideas. Use it to create without efforts professional Reflected Ceiling plans and Reflective Ceiling plans, showing the location of light fixtures, drywall or t-bar ceiling patterns, lighting panels, and HVAC grilles and diffusers that may be suspended from the ceiling.
 Security and Access Plans
This solution extends ConceptDraw PRO software with physical security plan, security chart, access chart, security plans, access schemes, access plans , CCTV System Plan samples, templates and libraries of design elements for drawing the Security and Acce
 Floor Plans
Construction, repair and remodeling of the home, flat, office, or any other building or premise begins with the development of detailed building plan and floor plans. Correct and quick visualization of the building ideas is important for further construction of any building.
HelpDesk
How to Draw a Histogram in ConceptDraw PRO

HelpDesk
How to Create Data-driven Infographics

Fire Exit Plan. Building Plan Examples

- Sample Bar And Grill Floor Plans
- Sports Bar Floor Plan Design
- Sports bar - Floor plan | Cafe and Restaurant Floor Plan | Sports bar ...
- Sports bar - Floor plan | Cafe and Restaurant Floor Plan | How To ...
- Bar Floor Plan Sample Design
- How To Create Restaurant Floor Plan in Minutes | Sports bar - Floor ...
- Examples Of Small Coffee Shop Floor Plans
- How To Create Restaurant Floor Plan in Minutes | Emergency Plan ...
- Bar Floor Plan Design
- Floor Plans | Network Layout Floor Plans | Cafe and Restaurant ...
- Floor Plan For Bar
- Sports bar - Floor plan | Home network plan | Design elements ...
- Bar Floor Plans
- Cafe and Restaurant Floor Plan | How To Create Restaurant Floor ...
- Cafe Floor Plan . Cafe Floor Plan Examples
- Coffeehouse plan | Sports bar - Floor plan | Bathroom - Vector ...
- How To Create Restaurant Floor Plan in Minutes | Cafe and ...
- Free Sports Bar Floor Plan
- How To Create Restaurant Floor Plan in Minutes | Restaurant Floor ...
- Cafe and Restaurant Floor Plan | Cafe Floor Plan Design Software ...