Pie Chart
ConceptDraw PRO diagramming and vector drawing software offers the Pie Charts solution from the Graphs and Charts area of ConceptDraw Solution Park for quick and easy drawing the Pie Chart of any complexity.Pie Chart Examples and Templates
A pie chart or a circle graph is a circular chart divided into sectors, illustrating numerical proportion. In a pie chart, the arc length of each sector and consequently its central angle and area, is proportional to the quantity it represents. Pie chart examples and templates created using ConceptDraw PRO software helps you get closer with pie charts and find pie chart examples suite your needs.Pictures of Graphs
ConceptDraw PRO diagramming and vector drawing software extended with Picture Graphs solution from the Graphs and Charts Area is the best choice for making professional looking pictures of graphs and colorful picture graphs.
 Food Court
Use the Food Court solution to create food art. Pictures of food can be designed using libraries of food images, fruit art and pictures of vegetables.
Basic Diagramming
Perfect charts and graphics diagramming software with rich examples and template. ConceptDraw is ideal to draw Charts and Graphics.
 Health Food
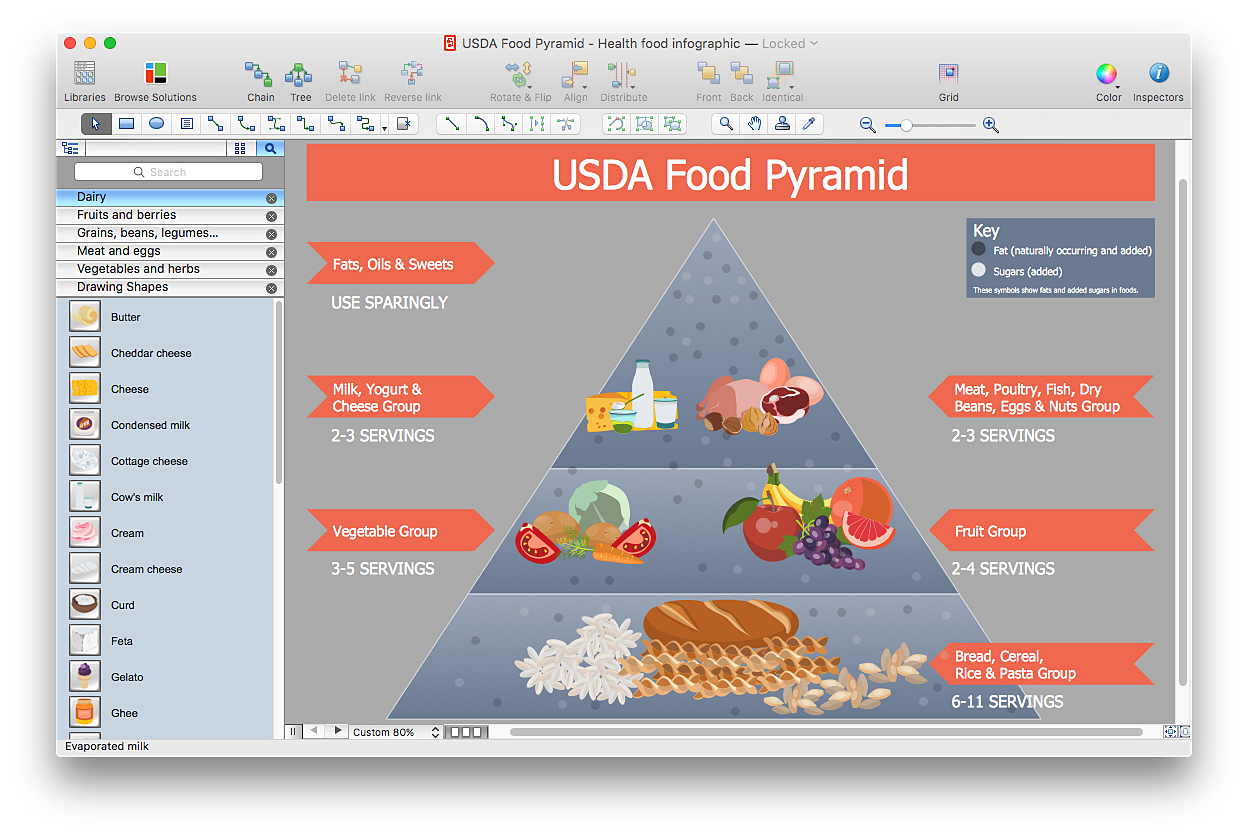
The Health Food solution contains the set of professionally designed samples and large collection of vector graphic libraries of healthy foods symbols of fruits, vegetables, herbs, nuts, beans, seafood, meat, dairy foods, drinks, which give powerful possi
Pie Chart Word Template. Pie Chart Examples
The Pie Chart visualizes the data as the proportional parts of a whole and looks like a disk divided into sectors. The pie chart is type of graph, pie chart looks as circle devided into sectors. Pie Charts are widely used in the business, statistics, analytics, mass media. It’s very effective way of displaying relative sizes of parts, the proportion of the whole thing.HelpDesk
How to Create Infographics that Help People Eat Healthy
The most effective manner of presenting information on healthy diet and food nutrition is using various visualizations such as charts or infographics. To help easily create infographics and diagrams of healthy eating, ConceptDraw has provided the Health Food solution to its Solution Park. It contains vector stencil libraries of healthy eating options, samples of diagrams and infographics, and a set of templates to help you create your own diagrams, infographics and even adds. Using ConceptDraw PRO you can easily create and share healthy food recipes and materials about the proper nutrition.
 Circle-Spoke Diagrams
Examples of subject areas that are well suited to this approach are marketing, business, products promotion, process modeling, market, resource, time, and cost analysis. Circle-Spoke Diagrams are successfully used in presentations, conferences, management documents, magazines, reportages, reviews, reports, TV, and social media.
How to Create a Pie Chart
Create a Pie Chart with ConceptDraw software quickly and easily. The simple tutorial helps you learn how to create a pie chart.Circle Spoke Diagram Template
ConceptDraw PRO diagramming and vector drawing software offers the Circle Spoke Diagram Template included in the Circle-Spoke Diagrams Solution from the "What is a Diagram" Area. Use of ready template is the easiest way of drawing professional looking Circle-Spoke Diagrams.Best Diagramming
Need to draw a diagram, process chart, flowchart, organizational chart, graphic design? ConceptDraw can help you to make professional graphic documents quickly.
 Basic Bar Graphs
This solution enhances ConceptDraw PRO v10.3.0 (or later) with templates, samples and a library of vector stencils for drawing Bar Graphs.
Competitor Analysis
Competitor analysis is a first and obligatory step in elaboration the proper corporate marketing strategy and creating sustainable competitive advantage. Use powerful opportunities of numerous solutions from ConceptDraw Solution Park for designing illustrative diagrams, charts, matrices which are necessary for effective competitor analysis.3 Ways to Quickly Create Excellent Presentations
When you decide to represent data without spending lots of time you can effectively generate, change, and update your presentation to best meet your needs with ConceptDraw MINDMAP.- Healthy Diet Plan | Healthy Diet | Food Pictures | Image Of Balance ...
- Health Food | Balanced Diet Pie Chart
- Balance Diet Chart Diagram
- Balanced Diet Chart With Percentage And Pictures
- Health Food | Circular Chart Of Balance Diet Drawing
- Healthy Diet Plan | Pie Charts | Healthy Diet | How To Draw A ...
- Healthy Meal Recipes | Healthy Diet Plan | Balanced Diet Chat ...
- Healthy Diet Plan | Basic Flowchart Images. Flowchart Examples | 3 ...
- Healthy Diet Plan | Healthy Diet | Healthy Meal Recipes | Drawing Of ...
- Healthy Diet Plan | Healthy Meal Recipes | Healthy Foods | How To ...
- Healthy Diet Plan | Export from ConceptDraw PRO Document to a ...
- Healthy Diet Plan | Healthy Foods | Health Food | How To Make A ...
- Pic Of Balance Diet Chart
- Program Evaluation and Review Technique (PERT) with ...
- Bar Graphs | 3 Ways to Quickly Create Excellent Presentations ...
- Healthy Foods | Healthy Diet Plan | Health Food | Health Circle Images
- Pie Graph Worksheets | Bar Graph | Chart Examples | Images Of Bar ...
- Draw Arrow Balanced Diet Chart
- Pie Charts | DroidDia prime | Pie Chart Software | Circle Graph Png ...


