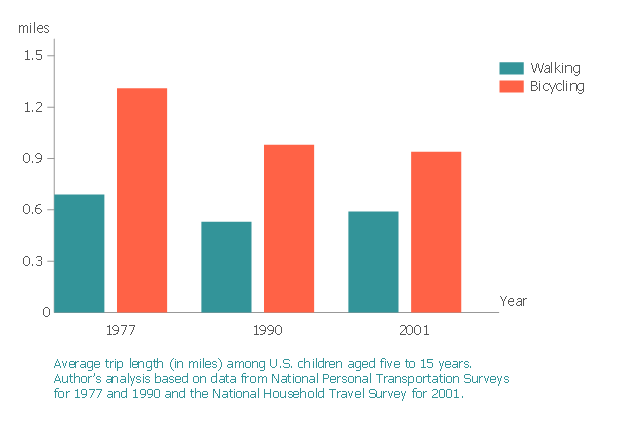
This bar graph sample shows the average trip length (in miles) among U.S. children aged five to 15 years. It was designed on the base of the figure 3 from the article "Childhood Obesity — What We Can Learn From Existing Data on Societal Trends, Part 2" on the U.S. Centers for Disease Control and Prevention (CDC) website.
"Active transportation, such as walking or biking, can expend a large amount of energy, and it has been hypothesized that increased suburbanization reduces walking and biking. Only recently have transportation patterns and urban design in relation to physical activity and health attracted interest. Although research has been limited to cross-sectional comparisons and adults, it has shown an association between increases in sprawl and decreases in leisure time and utilitarian walking and increases in body mass index and chronic health conditions." [cdc.gov/ pcd/ issues/ 2005/ apr/ 04_ 0039.htm]
The column chart example "Average trip length among U.S. children" was created using the ConceptDraw PRO diagramming and vector drawing software extended with the Bar Graphs solution from the Graphs and Charts area of ConceptDraw Solution Park.
Column chart
Bar Chart Examples

 Bar Graphs
The Bar Graphs solution enhances ConceptDraw PRO v10 functionality with templates, numerous professional-looking samples, and a library of vector stencils for drawing different types of Bar Graphs, such as Simple Bar Graph, Double Bar Graph, Divided Bar Graph, Horizontal Bar Graph, Vertical Bar Graph, and Column Bar Chart.
Rainfall Bar Chart

Bar Diagrams for Problem Solving. Create manufacturing and economics bar charts with Bar Graphs Solution

HelpDesk
How to Draw a Line Chart Quickly

Graphical Symbols to use in EPC diagrams
")
Ice Hockey Rink Dimensions

 Picture Graphs
Typically, a Picture Graph has very broad usage. They many times used successfully in marketing, management, and manufacturing. The Picture Graphs Solution extends the capabilities of ConceptDraw PRO v10 with templates, samples, and a library of professionally developed vector stencils for designing Picture Graphs.
SDL Flowchart Symbols

How To Draw Building Plans


 Meter Dashboard
Meter dashboard solution extends ConceptDraw PRO software with templates, samples and vector stencils library with meter indicators for drawing visual dashboards showing quantitative data.
Wireframe Tools

- Rainfall Bar Chart | Chart Maker for Presentations | Bar Chart ...
- Average trip length among U.S. children | Funny transport - Vector ...
- Bar Graphs | Bar Diagram Math | Rainfall Bar Chart | Divided Simple ...
- Rainfall Bar Chart | Bar Chart Examples | Financial Comparison ...
- Bar Chart Examples | Rainfall Bar Chart | How to Create a Bar Chart ...
- How to Draw a Divided Bar Chart in ConceptDraw PRO | Divided ...
- Bar Graphs | Bar Chart Examples | Bar Diagrams for Problem ...
- Bar Chart Examples | Rainfall Bar Chart | Chart Maker for ...
- Double bar graph - Template | Double bar chart - Nitrate ...
- How to Draw a Histogram in ConceptDraw PRO | Rainfall Bar Chart ...
- Financial Comparison Chart | Rainfall Bar Chart | Bar Graph | Bar ...
- Bar Chart Template for Word | Double bar graph - Template | Chart ...
- Bar Chart Template | Chart Maker for Presentations | Bar Chart ...
- Financial Comparison Chart | Sales Growth. Bar Graphs Example ...
- Financial Comparison Chart | Rainfall Bar Chart | Bar Graph | How ...
- Smart Charts Images
- Bar Chart Template for Word | Column Chart Template | Chart Maker ...
- Bar Diagrams for Problem Solving. Create space science bar charts
- Feature Comparison Chart Software | Design elements ...
- Financial Comparison Chart | Percentage Pie Chart . Pie Chart ...