Circular Arrow

Circular Arrows

Circular Flow Diagram Template

The vector stencils library "Marketing indicators" contains 12 graphic indicators: horizontal bar chart, pie chart, arrow chart, donut chart, square chart, stickman row pictograph, progress bar, bullet indicator, radial gauge, semi-radial gauge.
Use these visual indicators to design your marketing infograms.
The shapes example "Design elements - Marketing indicators" was created using the ConceptDraw PRO diagramming and vector drawing software extended with the Marketing Infographics solition from the area "Business Infographics" in ConceptDraw Solution Park.
Graphic indicators

Flowchart design. Flowchart symbols, shapes, stencils and icons


Process Flowchart


Use Case Diagrams technology with ConceptDraw PRO

 Circular Arrows Diagrams
Circular Arrows Diagrams solution extends ConceptDraw PRO v10 with extensive drawing tools, predesigned samples, Circular flow diagram template for quick start, and a library of ready circular arrow vector stencils for drawing Circular Arrow Diagrams, Segmented Cycle Diagrams, and Circular Flow Diagrams. The elements in this solution help managers, analysts, business advisers, marketing experts, scientists, lecturers, and other knowledge workers in their daily work.
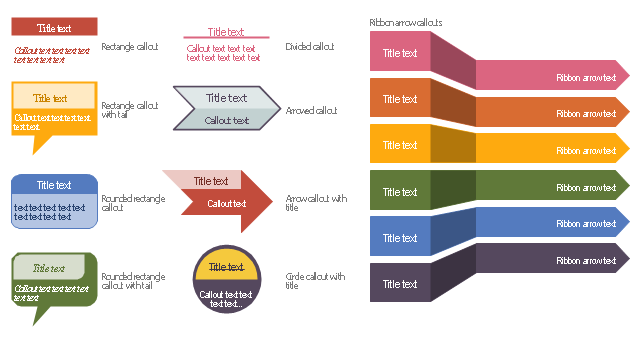
The vector stencils library "Education titled callouts" contains 14 titled callout blocks.
Use it to design your educational infograms.
"In publishing, a call-out or callout is a short string of text connected by a line, arrow, or similar graphic to a feature of an illustration or technical drawing, and giving information about that feature. The term is also used to describe a short piece of text set in larger type than the rest of the page and intended to attract attention.
A similar device in word processing is a special text box with or without a small "tail" that can be pointed to different locations on a document." [Callout. Wikipedia]
The shapes example "Design elements - Education titled callouts" was created using the ConceptDraw PRO diagramming and vector drawing software extended with the Education Infographics solition from the area "Business Infographics" in ConceptDraw Solution Park.
Titled callout blocks
The vector stencils library "Progressive disclosure controls" contains 12 icons of Windows 8 progressive disclosure controls.
Use it to design graphic user interface (GUI) prototypes of your software applications for Windows 8.
"With a progressive disclosure control, users can show or hide additional information including data, options, or commands. Progressive disclosure promotes simplicity by focusing on the essential, yet revealing additional detail as needed. ...
Chevrons show or hide the remaining items in completely or partially hidden content. Usually the items are shown in place, but they can also be shown in a pop-up menu. When in place, the item stays expanded until the user collapses it. ...
Arrows show a pop-up command menu. The item stays expanded until the user makes a selection or clicks anywhere.
If the arrow button is an independent control, it receives input focus and is activated with the space bar. If the arrow button has a parent control, the parent receives input focus and the arrow is activated with Alt+down arrow and Alt+up arrow keys, as with the drop-down list control. ...
Plus and minus controls expand or collapse to show container content in place when navigating through a hierarchy. The item stays expanded until the user collapses it. Although these look like buttons, their behavior is in-place.
The associated object receives input focus. The plus is activated with the right arrow key, and the minus with the left arrow key. ...
Rotating triangles show or hide additional information in place for an individual item. They are also used to expand containers. The item stays expanded until the user collapses it.
The associated object receives input focus. The collapsed (right-pointing) triangle is activated with the right arrow key, and the expanded (downward-pointing) triangle with the left arrow key. ...
Like chevrons, additional information is shown or hidden in place. The item stays expanded until the user collapses it. Unlike chevrons, the glyphs have a graphical representation of the action, typically with an arrow indicating what will happen. ... Preview arrows are best reserved for situations where a standard chevron doesn't adequately communicate the control's behavior, such as when the disclosure is complex or there is more than one type of disclosure." [msdn.microsoft.com/ en-us/ library/ windows/ desktop/ dn742409%28v=vs.85%29.aspx]
The icons example "Progressive disclosure controls - Vector stencils library" was created using the ConceptDraw PRO diagramming and vector drawing software extended with the Windows 8 User Interface solution from the Software Development area of ConceptDraw Solution Park.
Single chevron control - down
Single chevron control - up
Double chevron control - back
Double chevron control - forward
Arrow control button - down
Arrow control button - right
Arrow control - down
Arrow control - right
Plus control
Minus control
Rotating triangle - expand

Rotating triangle - collapse
 Basic Circular Arrows Diagrams
This solution extends ConceptDraw PRO v10 (or later) with samples, templates, and a library of vector stencils for drawing circular arrow diagrams.
Ice Hockey Diagram – Penalty Kill Forecheck Angling Drill

IDEF0 standard with ConceptDraw PRO

- Arrow Round And Around Graphics
- Innovation life cycle - Arrow loop diagram | Basic Flowchart Symbols ...
- Free Graphic Of North Arrow
- Business Graphics Software | Customer Relationship Management ...
- Circular Arrows Diagrams | Circular Arrow | Arrow circle chart ...
- Circular Flow Diagram Template | Circular Arrows | Circular Arrow ...
- Circular arrows diagrams - Vector stencils library | How to Draw the ...
- North Arrow Graphic Design
- How to Draw a Circular Arrows Diagram Using ConceptDraw PRO ...
- Basic Flowchart Symbols and Meaning | Arrow circle chart ...
- Offensive Play – Double Wing Wedge – Vector Graphic Diagram ...
- Circular Arrows
- Research cycle - Circle diagram | Export from ConceptDraw PRO ...
- Basic Flowchart Symbols and Meaning | Circular Arrow ...
- Offensive Play – Double Wing Wedge – Vector Graphic Diagram
- Design elements - Callout blocks | Design elements - Education ...
- Png Image Arrow
- Design elements - Management titled callouts | Design elements ...
- Circular Arrows Diagrams | Holiday | Line Graphs | 5 Arrow Circular ...
- Design elements - Education titled callouts | Design elements ...