This example of cloud computing system architecture diagram was created on the base of picture in the post "Sending Windows 8 Push Notifications using Windows Azure Mobile Services" from the Nick Harris .NET blog.
"The goal of Windows Azure Mobile Services is to make it incredibly easy for developers to add a cloud backend to their client apps be it a Windows 8, Windows Phone, iOS or Android application. ... Mobile Services today provides:
- Structured Storage
- Server Logic ...
- Auth ...
- Push Notifications ...
- Common tenants of Windows Azure Services
- Scale ...
- Diagnostics ...
- Logging ...
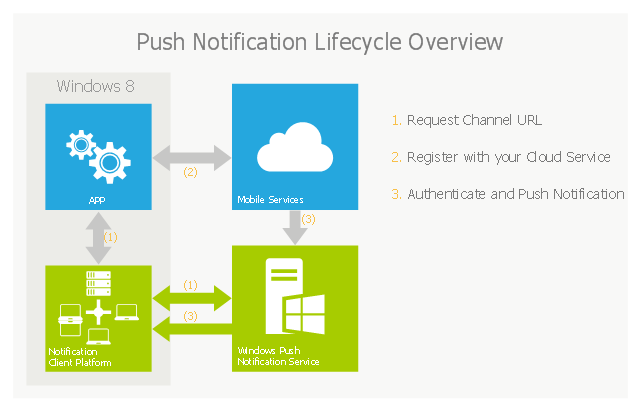
What are Push Notifications?
The Windows Push Notification Services (WNS) enables you to send toast, tile, badge and raw notifications from the cloud to your Windows Store applications even when your app is not running. Push notifications are ideal for scenarios when you need to target a specific user with personalized content.
The following diagram depicts the general Lifecycle of a push notifications via the Windows Azure Notification Service (WNS). We’ll walk through the steps shortly but before doing so I thought it would be important to call out that as a developer implementing a push notification scenario all you need to do is implement those interactions in grey and the applications/ services in blue." [nickharris.net/ index.php/ 2012/ 10/ 04/ blog-series-sending-windows-8-push-notifications-using-windows-azure-mobile-services/ ]
The diagram example "Push Notification Lifecycle Overview" was created using ConceptDraw PRO diagramming and vector drawing software extended with the Azure Architecture solution from the Computer and Networks area of ConceptDraw Solution Park.
"The goal of Windows Azure Mobile Services is to make it incredibly easy for developers to add a cloud backend to their client apps be it a Windows 8, Windows Phone, iOS or Android application. ... Mobile Services today provides:
- Structured Storage
- Server Logic ...
- Auth ...
- Push Notifications ...
- Common tenants of Windows Azure Services
- Scale ...
- Diagnostics ...
- Logging ...
What are Push Notifications?
The Windows Push Notification Services (WNS) enables you to send toast, tile, badge and raw notifications from the cloud to your Windows Store applications even when your app is not running. Push notifications are ideal for scenarios when you need to target a specific user with personalized content.
The following diagram depicts the general Lifecycle of a push notifications via the Windows Azure Notification Service (WNS). We’ll walk through the steps shortly but before doing so I thought it would be important to call out that as a developer implementing a push notification scenario all you need to do is implement those interactions in grey and the applications/ services in blue." [nickharris.net/ index.php/ 2012/ 10/ 04/ blog-series-sending-windows-8-push-notifications-using-windows-azure-mobile-services/ ]
The diagram example "Push Notification Lifecycle Overview" was created using ConceptDraw PRO diagramming and vector drawing software extended with the Azure Architecture solution from the Computer and Networks area of ConceptDraw Solution Park.
Cloud computing system architecture diagram
How to Build Cloud Computing Diagram Principal Cloud Manufacturing

Flow Chart Creator

Windows Azure

 Target and Circular Diagrams
This solution extends ConceptDraw PRO software with samples, templates and library of design elements for drawing the Target and Circular Diagrams.
JSD - Jackson system development

 Flowcharts
The Flowcharts Solution for ConceptDraw PRO v10 is a comprehensive set of examples and samples in several different color themes for professionals that need to graphically represent a process. Solution value is added by basic flow chart template and shapes' library of Flowchart notation. ConceptDraw PRO flow chart creator lets one depict a processes of any complexity and length, as well design of the flowchart either vertically or horizontally.
 Sales Flowcharts
The Sales Flowcharts solution lets you create and display sales process maps, sales process workflows, sales steps, the sales process, and anything else involving sales process management.
 Business Process Workflow Diagrams
The Business Process Workflow Diagrams solution enhances the ConceptDraw PRO v10 functionality with predesigned examples, samples and a numerous collection of predesigned vector objects of workflow chart elements, icons, arrows, connectors, and varied wor
 Circular Arrows Diagrams
Circular Arrows Diagrams solution extends ConceptDraw PRO v10 with extensive drawing tools, predesigned samples, Circular flow diagram template for quick start, and a library of ready circular arrow vector stencils for drawing Circular Arrow Diagrams, Segmented Cycle Diagrams, and Circular Flow Diagrams. The elements in this solution help managers, analysts, business advisers, marketing experts, scientists, lecturers, and other knowledge workers in their daily work.
 IDEF0 Diagrams
IDEF0 Diagrams visualize system models using the Integration Definition for Function Modeling (IDEF) methodology. Use them for analysis, development and integration of information and software systems, and business process modelling.
 Cloud Computing Diagrams
The Cloud Computing Diagrams solution extends the functionality of the ConceptDraw PRO software with comprehensive collection of libraries of cloud computing vector stencils to help you get started design of Cloud Computing Diagrams and Architecture D
How to Build a Flowchart

 PM Dashboards
This solution extends ConceptDraw PRO and ConceptDraw PROJECT software with the ability to clearly display the identified key performance indicators for any project.
 Collaboration Area
The solutions from Collaboration area of ConceptDraw Solution Park extend ConceptDraw PRO and ConceptDraw MINDMAP software with features, samples, templates and vector stencils libraries for drawing diagrams and mindmaps useful for collaboration.
- How to Build Cloud Computing Diagram Principal Cloud ...
- Cloud Computing Architecture Diagrams | Push Notification ...
- How to Build Cloud Computing Diagram Principal Cloud ...
- Cloud Computing Architecture Diagrams | Push Notification ...
- Push Notification Lifecycle Overview | Cloud Computing Architecture ...
- Push Notification Lifecycle Overview | Cloud Computing Architecture ...
- Push Notification Lifecycle Overview | Network Topologies | IDEF1X ...
- Push Notification Lifecycle Overview | Microsoft Azure reference ...
- Cloud Cycle
- Draw The Application Lifecycle
- Innovation life cycle - Arrow loop diagram | BPM life cycle | Product ...
- Draw The All Life Cycle
- Innovation life cycle - Arrow loop diagram | Circular arrows diagram ...
- Cloud Computing Architecture Diagrams | Diagramming tool ...
- Mobile cloud architecture diagram | Push Notification Lifecycle ...
- Innovation life cycle - Arrow loop diagram | BPM life cycle | Systems ...
- How to Build Cloud Computing Diagram Principal Cloud ...
- Azure Services | How to Create an Azure Architecture Diagram ...
- Innovation life cycle - Arrow loop diagram | Draw Flowcharts with ...
- Cloud Computing Architecture Diagrams | Cloud Computing ...