Activity on Node Network Diagramming Tool

Program Evaluation and Review Technique (PERT) with ConceptDraw DIAGRAM

Activity Network Diagram Method

The PERT chart shows the logical connections and consequence of a set of tasks. PERT charts the time period for problem solving and the implementation plan for all activities along the critical path. The PERT chart is also known as a precedence diagram or project network diagram.
"The Program (or Project) Evaluation and Review Technique, commonly abbreviated PERT, is a statistical tool, used in project management, that is designed to analyze and represent the tasks involved in completing a given project. ...
PERT is a method to analyze the involved tasks in completing a given project, especially the time needed to complete each task, and to identify the minimum time needed to complete the total project.
PERT was developed primarily to simplify the planning and scheduling of large and complex projects. ...
A network diagram can be created by hand or by using diagram software. There are two types of network diagrams, activity on arrow (AOA) and activity on node (AON). Activity on node diagrams are generally easier to create and interpret." [Program Evaluation and Review Technique. Wikipedia]
The PERT chart is one of the Seven Management and Planning Tools (7 MP tools, Seven New Quality Tools).
The PERT chart template for the ConceptDraw PRO diagramming and vector drawing software is included in the solution "Seven Management and Planning Tools" from the Management area of ConceptDraw Solution Park.
PERT chart template

Legend

How to Create Gantt Chart

Bubble diagrams in Landscape Design with ConceptDraw DIAGRAM

Network Visualization with ConceptDraw DIAGRAM

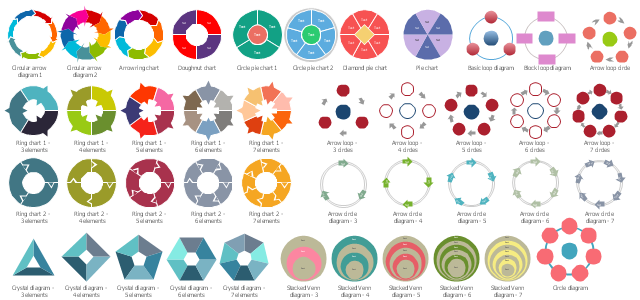
The vector stencils library "Circular diagrams" contains 42 templates of circular diagrams: circular arrow diagram, circular motion diagram, arrow ring chart, doughnut chart (donut chart), circle pie chart, diamond pie chart, circle diagram, pie chart, ring chart, loop diagram, block loop diagram, arrow loop circle, crystal diagram, triangular diagram, diamond diagram, pentagon diagram, hexagon diagram, heptagon diagram, cycle diagram (cycle chart), stacked Venn diagram (onion diagram), arrow circle diagram.
The example of marketing diagrams templates "Design elements - Circular diagrams" for the ConceptDraw PRO diagramming and vector drawing software is included the Target and Circular Diagrams solution from the Marketing area of ConceptDraw Solution Park.
www.conceptdraw.com/ solution-park/ marketing-target-and-circular-diagrams
Circular diagrams templates
ConceptDraw PROJECT Project Management Software Tool

Gane Sarson Diagram

- Aon Diagram Generator
- PERT chart - Template | Aon Using Pert
- Aon Diagram Excel Template
- How To Draw Aon Network Diagram
- PERT chart - Template | Activity On Node Diagram Template
- How To Draw Aon Diagram
- Draw Aon And Ganty Chart
- Solution Of Aon Diagram Of Production
- Activity on Node Network Diagramming Tool | Network Analysis ...
- PERT chart - Template | How To Create a PERT Chart | Pert Chart ...