Computer Network Diagrams
Computer Network Diagrams solution extends ConceptDraw DIAGRAM software with samples, templates and libraries of vector icons and objects of computer network devices and network components to help you create professional-looking Computer Network Diagrams, to plan simple home networks and complex computer network configurations for large buildings, to represent their schemes in a comprehensible graphical view, to document computer networks configurations, to depict the interactions between network's components, the used protocols and topologies, to represent physical and logical network structures, to compare visually different topologies and to depict their combinations, to represent in details the network structure with help of schemes, to study and analyze the network configurations, to communicate effectively to engineers, stakeholders and end-users, to track network working and troubleshoot, if necessary.
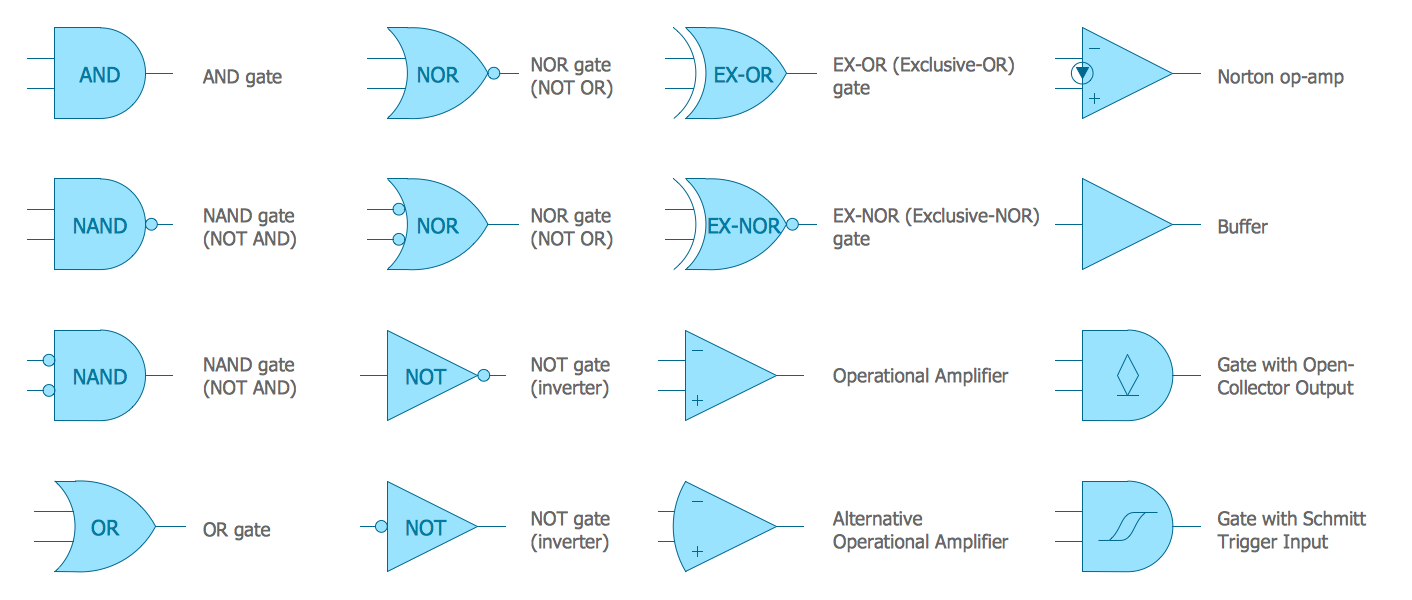
Electrical Symbols — Logic Gate Diagram
In electronics, a logic gate is an idealized or physical device implementing a Boolean function; that is, it performs a logical operation on one or more logical inputs, and produces a single logical output. Depending on the context, the term may refer to an ideal logic gate, one that has for instance zero rise time and unlimited fan-out, or it may refer to a non-ideal physical device 26 libraries of the Electrical Engineering Solution of ConceptDraw DIAGRAM make your electrical diagramming simple, efficient, and effective. You can simply and quickly drop the ready-to-use objects from libraries into your document to create the electrical diagram.Best Diagramming Software for macOS
ConceptDraw DIAGRAM creates drawings, flowcharts, block diagrams, bar charts, histograms, pie charts, divided bar diagrams, line graphs, area charts, scatter plots, circular arrows diagrams, Venn diagrams, bubble diagrams with great visual appeal on Mac OS X.
Process Flowchart
The main reason of using Process Flowchart or PFD is to show relations between major parts of the system. Process Flowcharts are used in process engineering and chemical industry where there is a requirement of depicting relationships between major components only and not include minor parts. Process Flowcharts for single unit or multiple units differ in their structure and implementation. ConceptDraw DIAGRAM is Professional business process mapping software for making Process flowcharts, Process flow diagram, Workflow diagram, flowcharts and technical illustrations for business documents and also comprehensive visio for mac application. Easier define and document basic work and data flows, financial, production and quality management processes to increase efficiency of your business with ConcepDraw DIAGRAM. Business process mapping software with Flowchart Maker ConceptDraw DIAGRAM includes extensive drawing tools, rich examples and templates, process flowchart symbols and shape libraries, smart connectors that allow you create the flowcharts of complex processes, process flow diagrams, procedures and information exchange. Process Flowchart Solution is project management workflow tools which is part ConceptDraw Project marketing project management software. Drawing charts, diagrams, and network layouts has long been the monopoly of Microsoft Visio, making Mac users to struggle when needing such visio alternative like visio for mac, it requires only to view features, make a minor edit to, or print a diagram or chart. Thankfully to MS Visio alternative like ConceptDraw DIAGRAM software, this is cross-platform charting and business process management tool, now visio alternative for making sort of visio diagram is not a problem anymore however many people still name it business process visio tools.
Bubble Diagrams
Bubble diagrams have enjoyed great success in software engineering, architecture, economics, medicine, landscape design, scientific and educational process, for ideas organization during brainstorming, for making business illustrations, presentations, planning, design, and strategy development. They are popular because of their simplicity and their powerful visual communication attributes.
Risk Diagram (Process Decision Program Chart)
The Risk Diagram or Process Decision Program Chart (PDPC) is intended to determine the risks of potential obstacles during the corrective actions that can be at the cases of their incorrect performing, and helps to develop effective preventive actions. Process Decision Program Chart it's kind of contingency plan to limit the risks, it determines the consequential impacts of failures on the activity plans. The Risk Plans and Process Decision Program Charts can be extended on several levels and take the form of tree or hierarchy, this form is incredibly convenient for representing the risks and countermeasures. ConceptDraw MINDMAP is powerful software tool for Business, Marketing and Project Management. It is also ideal for easy designing MINDMAP Risk Diagram or Process Decision Program Chart, due to the included "7 Management and Planning Tools" solution to ConceptDraw Solution Park. We recommend to start with Process Decision Program Chart (PDPC) template opening it from ConceptDraw STORE or from the Output tab at ConceptDraw MINDMAP application.Pyramid Diagram
The Time-Money-Quality Triangle illustrates an advertising truism, that you can't have all three.
Object-Role Modeling (ORM) Diagrams
Object-role Modeling (ORM) Diagram solution with powerful vector diagramming and data modeling tools, large quantity of specially developed samples and examples, and rich variety of vector objects corresponding to common ORM notation, ideally suits for developing the comprehensive, clear and visual Object-role Modeling (ORM) diagrams and schematics, understandable for all interested people from the different fields and business directions, for designing the ORM models, and demonstrating advantages from the use of ORM and its notation. It is intended for software developers and computer engineers, specialists in a field of Object-oriented programming (OOP), database architects, web-application constructors and developers, etc.
Entity Relationship Diagram Symbols
The semantic modeling method nowadays is successfully applied in database structure design. It is effective method of modeling the data structures, which is based on the meaning of these data. As a tool of semantic modeling, there are used different types of Entity-Relationship Diagrams. Entity Relationship Diagram (ERD) is applied to visually and clearly represent a structure of a business database. The main components of ERDs are: entity, relation and attributes. An entity is a class of similar objects in the model, each entity is depicted in the form of rectangle and has the name expressed by a noun. Relation is shown in the form of non-directional line that connects two entities. There are several notation styles used for ERDs: information engineering style, Chen style, Bachman style, Martin Style. The Entity Relationship Diagram symbols used for professional ERD drawing are predesigned by professionals and collected in the libraries of the Entity-Relationship Diagram (ERD) solution for ConceptDraw DIAGRAM software.
Rack Diagrams
The Rack Diagrams solution, including a vector stencil library, a collection of samples and a quick-start template, can be useful for all who deal with computer networks. Choosing any of the 54 library's vector shapes, you can design various types of Rack diagrams or Server rack diagrams visualizing 19" rack mounted computers and servers.
- Organizational culture - Triangle diagram | Block diagram - Types of ...
- Show Flow Chart Or Diagram Of Import Procedure
- Www Diagrams That Illustrate Current Trends
- Swim Lane Diagrams | Swim Lane Flowchart Symbols | Cross ...
- Process Flowchart | Simple Labelled Flow Charts Or Diagram In ...
- Payroll process - Swim lane process mapping diagram | Cross ...
- Competitor Analysis | Marketing Diagrams | Business Productivity ...
- Wireless access point - Network diagram | Hotel Network Topology ...
- Marketing Diagrams | ConceptDraw Solution Park | How To Explain ...
- Plant Layout Plans | Sketch Or Diagram Of Ware House