This arrow loop diagram sample was created on the base of the figure illustrating the article "Up Close and Personal. Life as an Intelligence Analyst" from the FBI website. [fbi.gov/ news/ stories/ 2006/ may/ arias050506]
"The traditional Intelligence cycle is the fundamental cycle of intelligence processing in a civilian or military intelligence agency or in law enforcement as a closed path consisting of repeating nodes. The stages of the intelligence cycle include the issuance of requirements by decision makers, collection, processing, analysis, and publication of intelligence. The circuit is completed when decision makers provide feedback and revised requirements. The intelligence cycle is also called the Intelligence Process by the U.S. Department of Defense (DoD) and the uniformed services." [Intelligence cycle. Wikipedia]
The arrow loop diagram example "Intelligence analyst cycle" was created using the ConceptDraw PRO diagramming and vector drawing software extended with the Target and Circular Diagrams solution from the Marketing area of ConceptDraw Solution Park.
www.conceptdraw.com/ solution-park/ marketing-target-and-circular-diagrams
Arrow loop diagram
The vector stencils library "Project management" contains 30 project management icons.
Use it to design your business and finance illustrations and infographics with ConceptDraw PRO diagramming and vector drawing software.
The vector stencils library "Project management" is included in the Business and Finance solution from the Illustration area of ConceptDraw Solution Park.
Use it to design your business and finance illustrations and infographics with ConceptDraw PRO diagramming and vector drawing software.
The vector stencils library "Project management" is included in the Business and Finance solution from the Illustration area of ConceptDraw Solution Park.
Start project

Project plan

Project scheme

To do list

Checklist

Project strategy

Timetable

Project time

Project fulfillment

Project Gantt chart

Project completed

Project report

Project management

Project descriptions

Communications

Project team

Project director

Project manager

Assignment of works

Project analyst

Project benefits

Failure to draw on the funds

Cost overrun

Cost

Project expenses

Portfolio

Ticket

Project task

Financial resources

Material resources

Business Process Flowchart Symbols

DFD Flowchart Symbols

The vector stencils library "Project management" contains 30 project management icons.
Use it to design your business and finance illustrations and infographics with ConceptDraw PRO diagramming and vector drawing software.
The vector stencils library "Project management" is included in the Business and Finance solution from the Illustration area of ConceptDraw Solution Park.
Use it to design your business and finance illustrations and infographics with ConceptDraw PRO diagramming and vector drawing software.
The vector stencils library "Project management" is included in the Business and Finance solution from the Illustration area of ConceptDraw Solution Park.
Start project
Project plan
Project scheme
To do list
Checklist
Project strategy
Timetable
Project time
Project fulfillment
Project Gantt chart
Project completed
Project report
Project management
Project descriptions
Communications
Project team
Project director
Project manager
Assignment of works
Project analyst
Project benefits
Failure to draw on the funds
Cost overrun
Cost
Project expenses
Portfolio
Ticket
Project task
Financial resources
Material resources
 Bubble Diagrams
Bubble diagrams have enjoyed great success in software engineering, architecture, economics, medicine, landscape design, scientific and educational process, for ideas organization during brainstorming, for making business illustrations, presentations, planning, design, and strategy development. They are popular because of their simplicity and their powerful visual communication attributes.
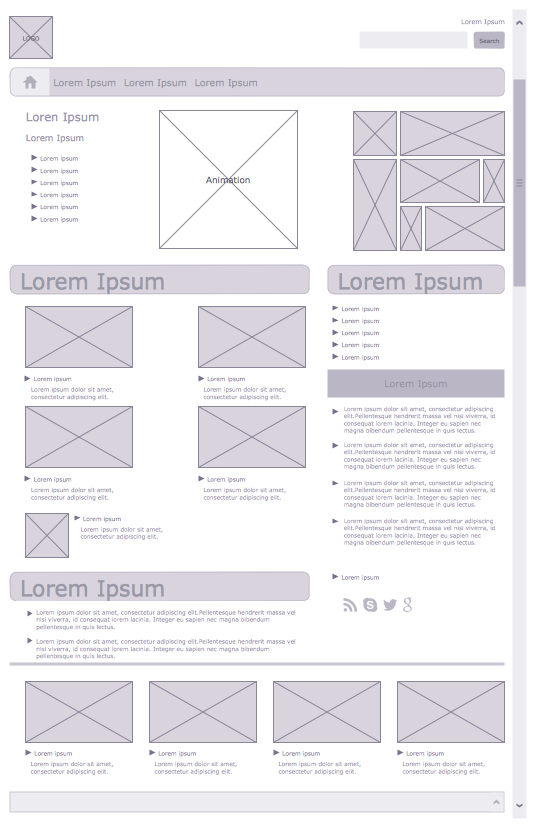
Wireframe Examples
This example was redesigned from the Wikipedia file: LastResortHotel BookRoom Process.png. [en.wikipedia.org/ wiki/ File:LastResortHotel_ BookRoom_ Process.png]
This file is licensed under the Creative Commons Attribution-ShareAlike 3.0 License. [creativecommons.org/ licenses/ by-sa/ 3.0/ ]
"Event partitioning is an easy-to-apply systems analysis technique that helps the analyst organize requirements for large systems into a collection of smaller, simpler, minimally-connected, easier-to-understand ‘mini systems’ / use cases. ...
Defining requirements.
Single process in a fictitious hotel using data flow diagram notation.
Single use case in a fictitious hotel using use case diagram notation.
This approach helps the analyst to decompose the system into ‘mentally bite-sized’ mini-systems using events that require a planned response. The level of detail of each response is at the level of ‘primary use cases’. Each planned response may be modelled using DFD notation or as a single use case using use case diagram notation.
The basic flow within a process or use case can usually be described in a relatively small number of steps, often fewer than twenty or thirty, possibly using something like ‘structured English’. Ideally, all of the steps would be visible all at once (often a page or less). The intention is to reduce one of the risks associated with short-term memory, namely, forgetting what is not immediately visible (‘out of sight, out of mind’). ...
Single process in a fictitious hotel using data flow diagram notation." [Event partitioning. Wikipedia]
The DFD example "Last resort hotel book room process" was created using the ConceptDraw PRO diagramming and vector drawing software extended with the Data Flow Diagrams solution from the Software Development area of ConceptDraw Solution Park.
DFD

Influence Diagram

Business Process Modeling Software for Mac

- Sales Flowcharts | Cross-Functional Flowcharts | System Analyst ...
- Product life cycle process - Flowchart | Intelligence analyst cycle ...
- Business Analyst Process Mapping
- Business Intelligence Dashboard | Intelligence analyst cycle - Arrow ...
- Last resort hotel book room process - DFD | Intelligence analyst ...
- Business Analyst Png
- Intelligence analyst cycle - Arrow loop diagram | The Circular Flow ...
- Intelligence analyst cycle - Arrow loop diagram | Target and Circular ...
- Wha Is An Analyst And A Computer Specialist Describe And The