The vector stencils library "Fault tree analysis diagrams" contains 12 symbols for drawing FTA diagrams in the ConceptDraw PRO diagramming and vector drawing software extended with the Fault Tree Analysis Diagrams solution from the Engineering area of ConceptDraw Solution Park.
www.conceptdraw.com/ solution-park/ engineering-fault-tree-analysis-diagrams
www.conceptdraw.com/ solution-park/ engineering-fault-tree-analysis-diagrams
AND gate

Priority AND gate

OR gate

Inhibit gate

XOR gate

Event

Basic event

Undeveloped event

House event

Conditional event

Transfer symbol

Voting gate

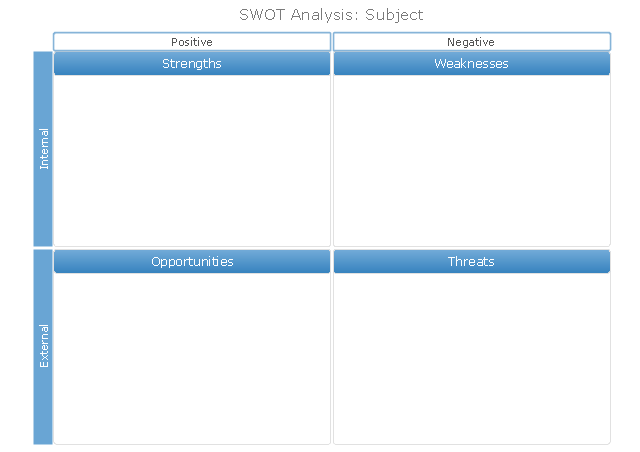
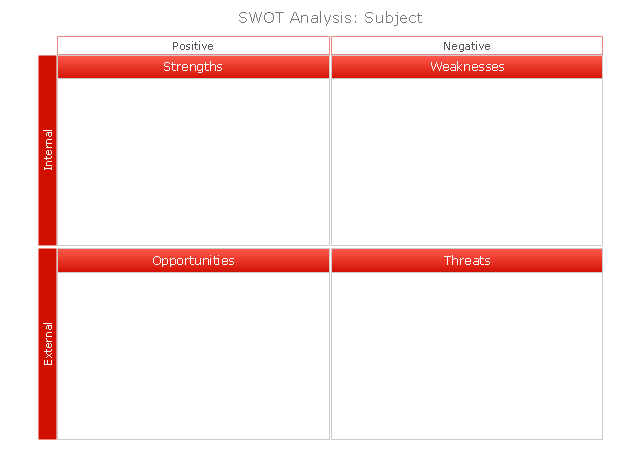
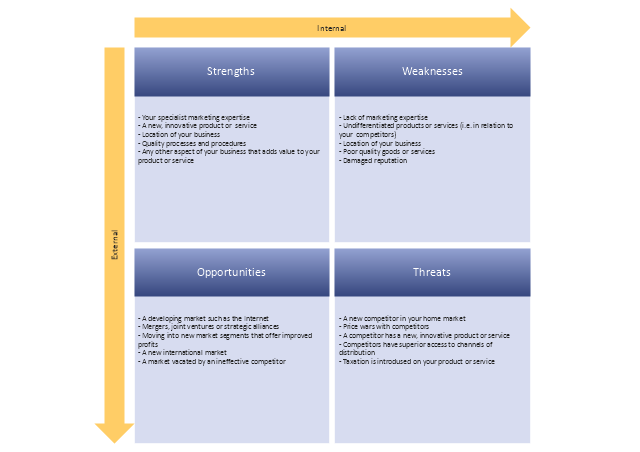
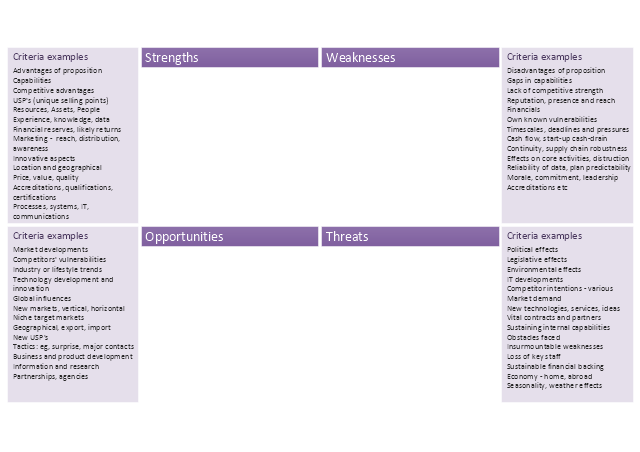
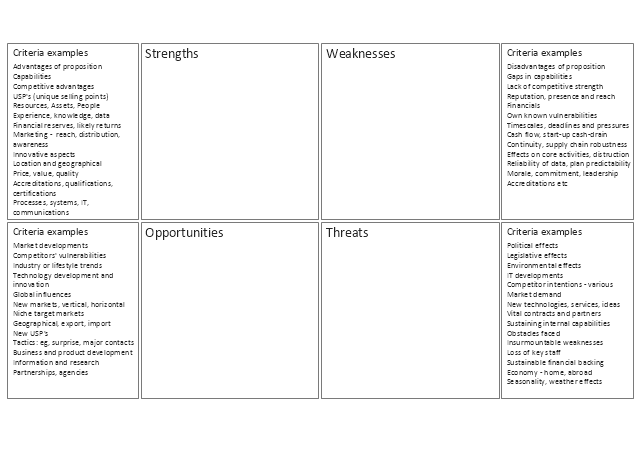
SWOT Matrix Template

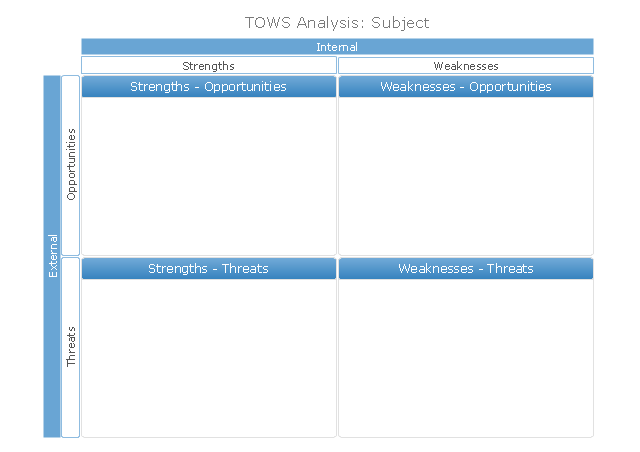
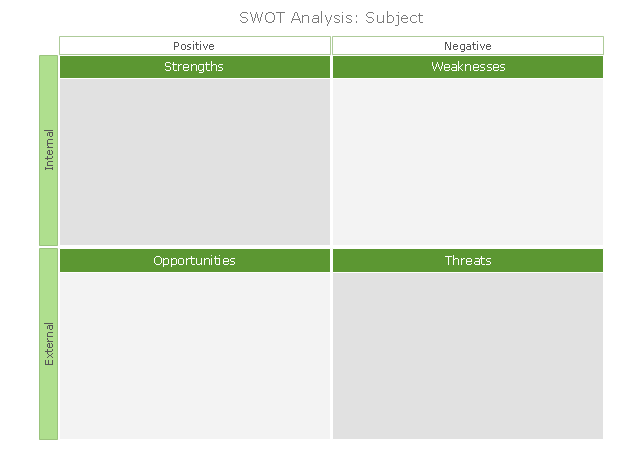
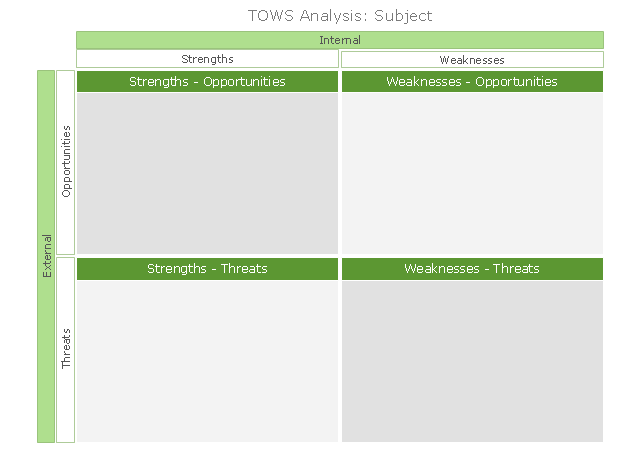
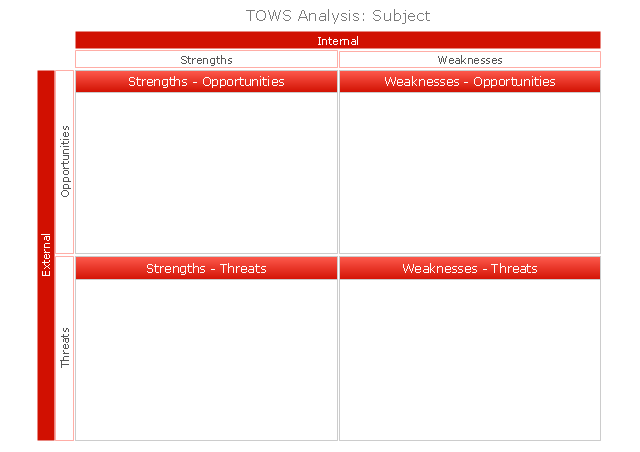
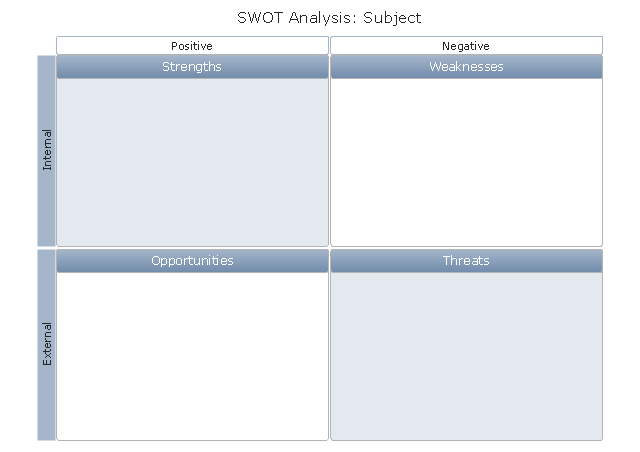
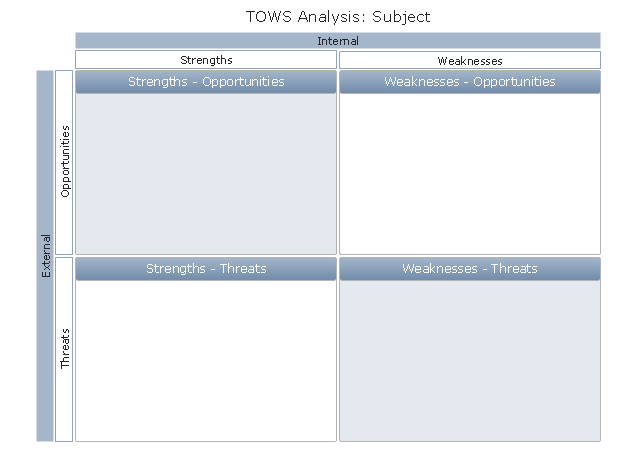
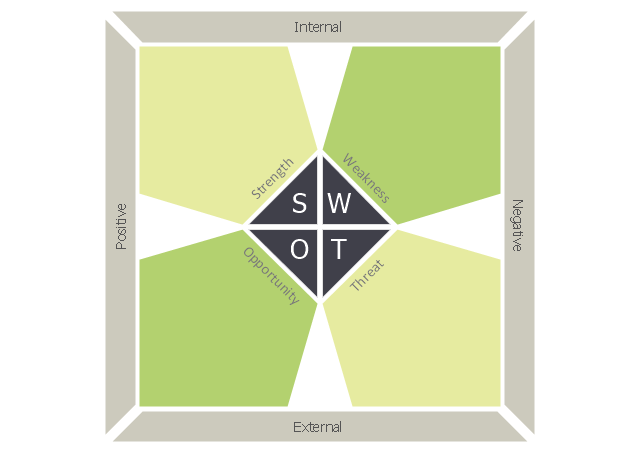
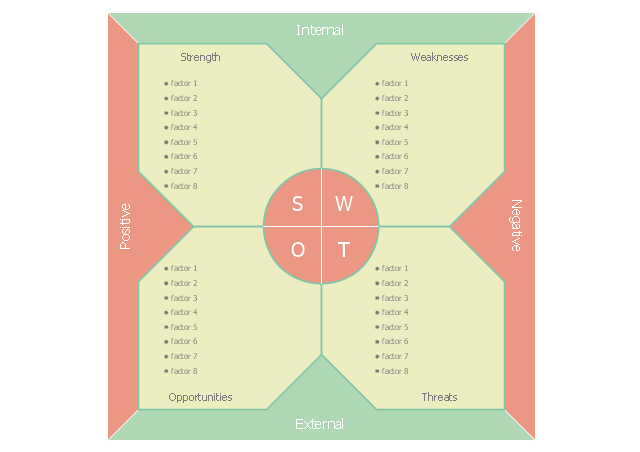
The vector stencils library "SWOT" contains 19 SWOT and TOWS analysis matrix diagram templates. Use it to create your SWOT and TOWS matrices in the ConceptDraw PRO diagramming and vector drawing software extended with the SWOT Analysis solution from the Management area of ConceptDraw Solution Park.
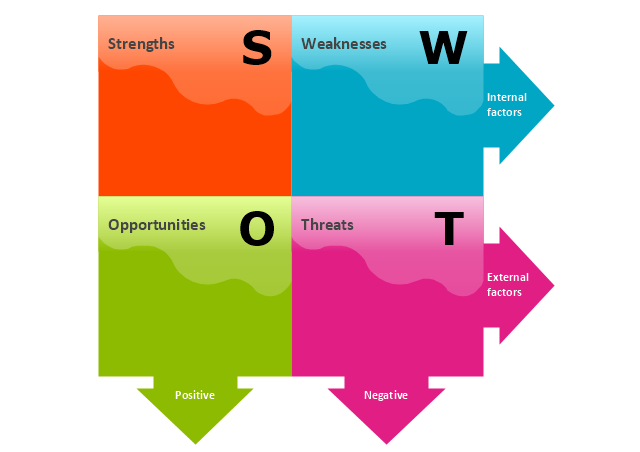
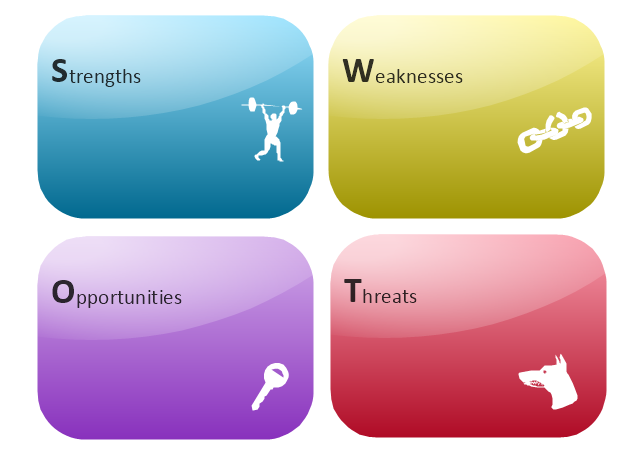
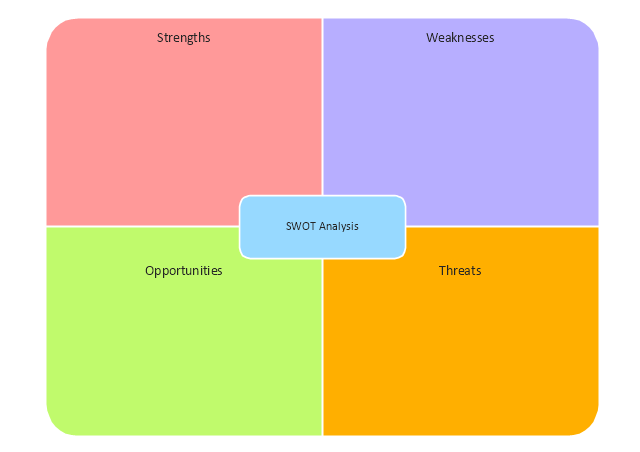
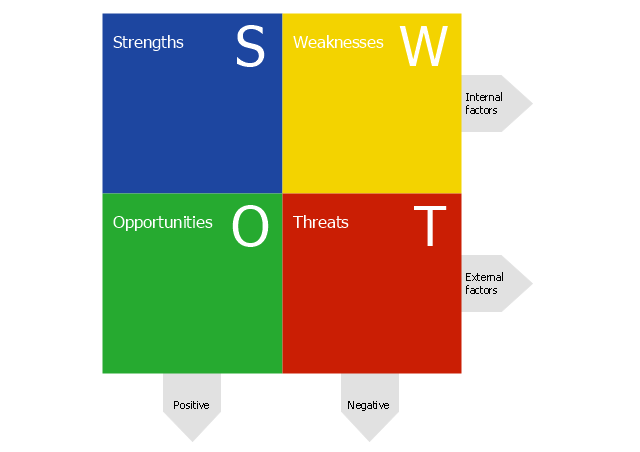
SWOT Matrix
TOWS Matrix
SWOT Matrix, green
TOWS Matrix, green
SWOT Matrix, red
TOWS Matrix, red
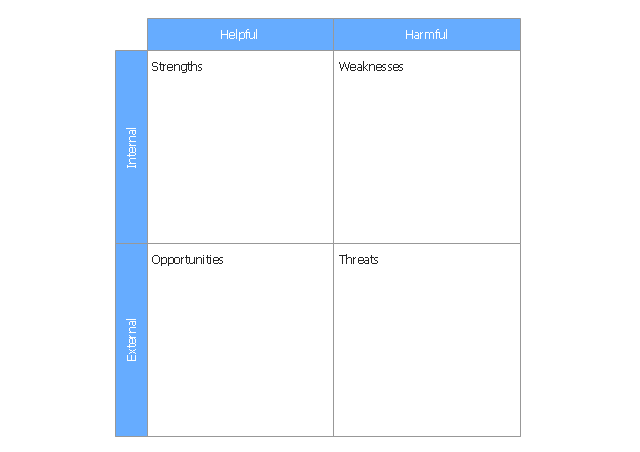
SWOT Matrix, soft
TOWS Matrix, soft
SWOT
SWOT Matrix
SWOT Matrix
SWOT Matrix
SWOT Analysis Matrix
SWOT Analysis Matrix - black and white
Pentagons SWOT matrix
SWOT analysis template
SWOT analysis positioning matrix
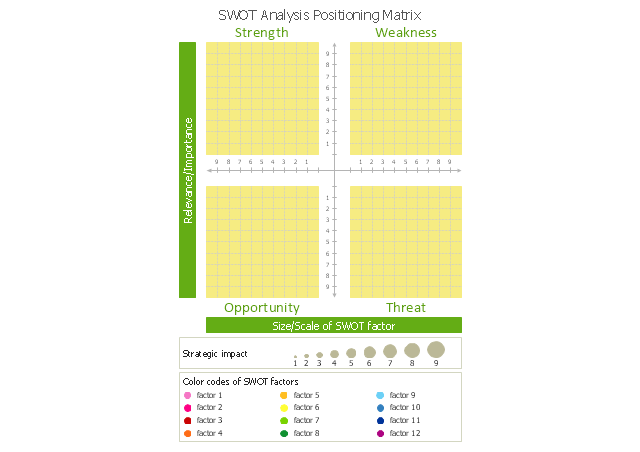
SWOT matrix
SWOT analysis
Process Flowchart


HelpDesk
How to Create a Fault Tree Analysis Diagram (FTD) in ConceptDraw PRO

Spatial Data Analysis

TOWS Analysis Software

Fault Tree Analysis Example

Fault Tree Analysis Software

Visualize Stakeholder Analysis

Cause and Effect Analysis

Marketing Plan Infographic

Structured Systems Analysis and Design Method (SSADM) with ConceptDraw PRO

Ishikawa Diagram

Pyramid Diagram

- Vectors For Site Analysis Png
- Lifestyle analysis - Method of travel to school | Education pictograms ...
- Performance Appraisal Report Vector Png
- Goal Png
- Objective Vector Png
- Travel Vector Png
- Cash Management Vector Png
- Plane geometry - Vector stencils library | Circular diagrams - Vector ...
- Vector Template Png
- Vector Png
- HR steps - Vector stencils library
- Coffee Vector Png
- Culture Presentation Vector Png
- Value stream mapping - Vector stencils library | What is Value ...
- Fault Tree Analysis Diagrams | Root cause analysis tree diagram ...
- Wholesale Vector Png
- SWOT analysis matrix diagram templates | Porter's value chain ...
- SWOT Analysis Solution - Strategy Tools | TOWS Matrix | SWOT and ...
- TOWS analysis matrix - Template | SWOT - Vector stencils library ...
- Competitor Analysis | Block diagram - Porter's five forces model ...