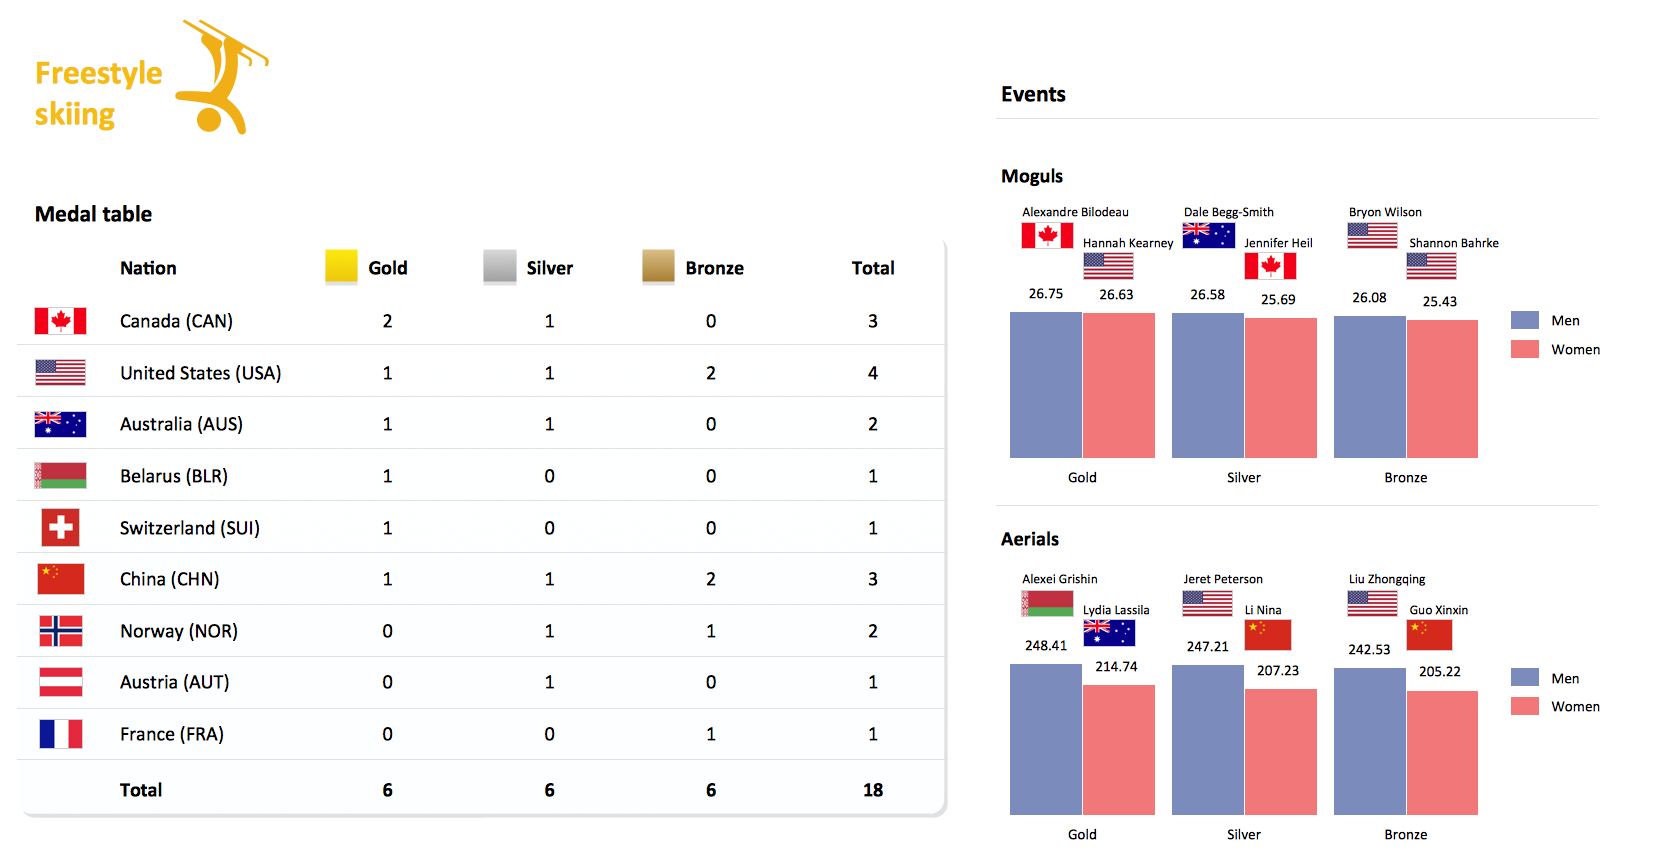
Winter Sports Vector Clipart. Medal Map. Spatial Infographics

 Fault Tree Analysis Diagrams
This solution extends ConceptDraw DIAGRAM.5 or later with templates, fault tree analysis example, samples and a library of vector design elements for drawing FTA diagrams (or negative analytical trees), cause and effect diagrams and fault tree diagrams.
 SWOT and TOWS Matrix Diagrams
SWOT and TOWS Matrix Diagrams solution extends ConceptDraw DIAGRAM and ConceptDraw MINDMAP software with features, templates, samples and libraries of vector stencils for drawing SWOT and TOWS analysis matrices and mind maps.
How to Draw Pictorial Chart. How to Use Infograms

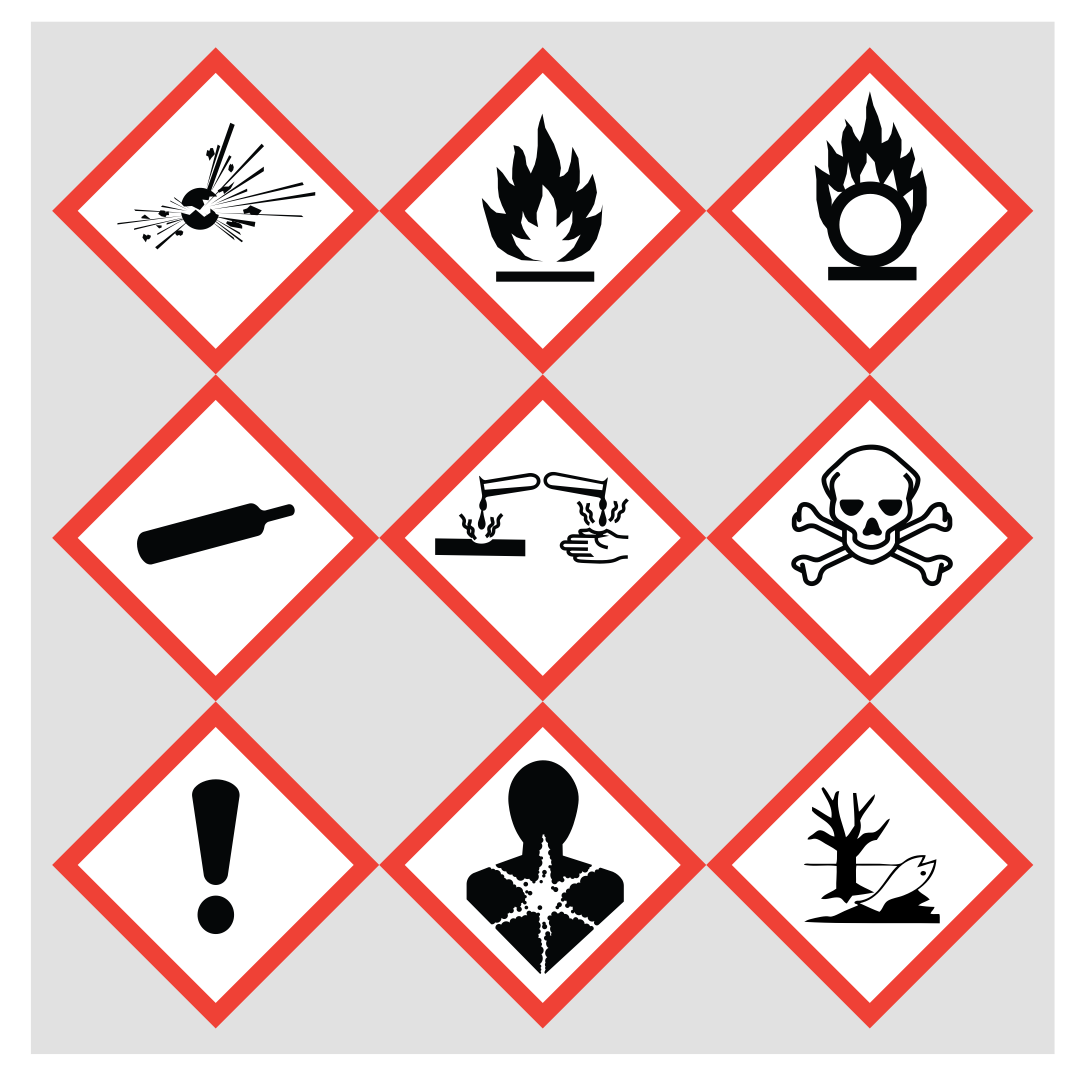
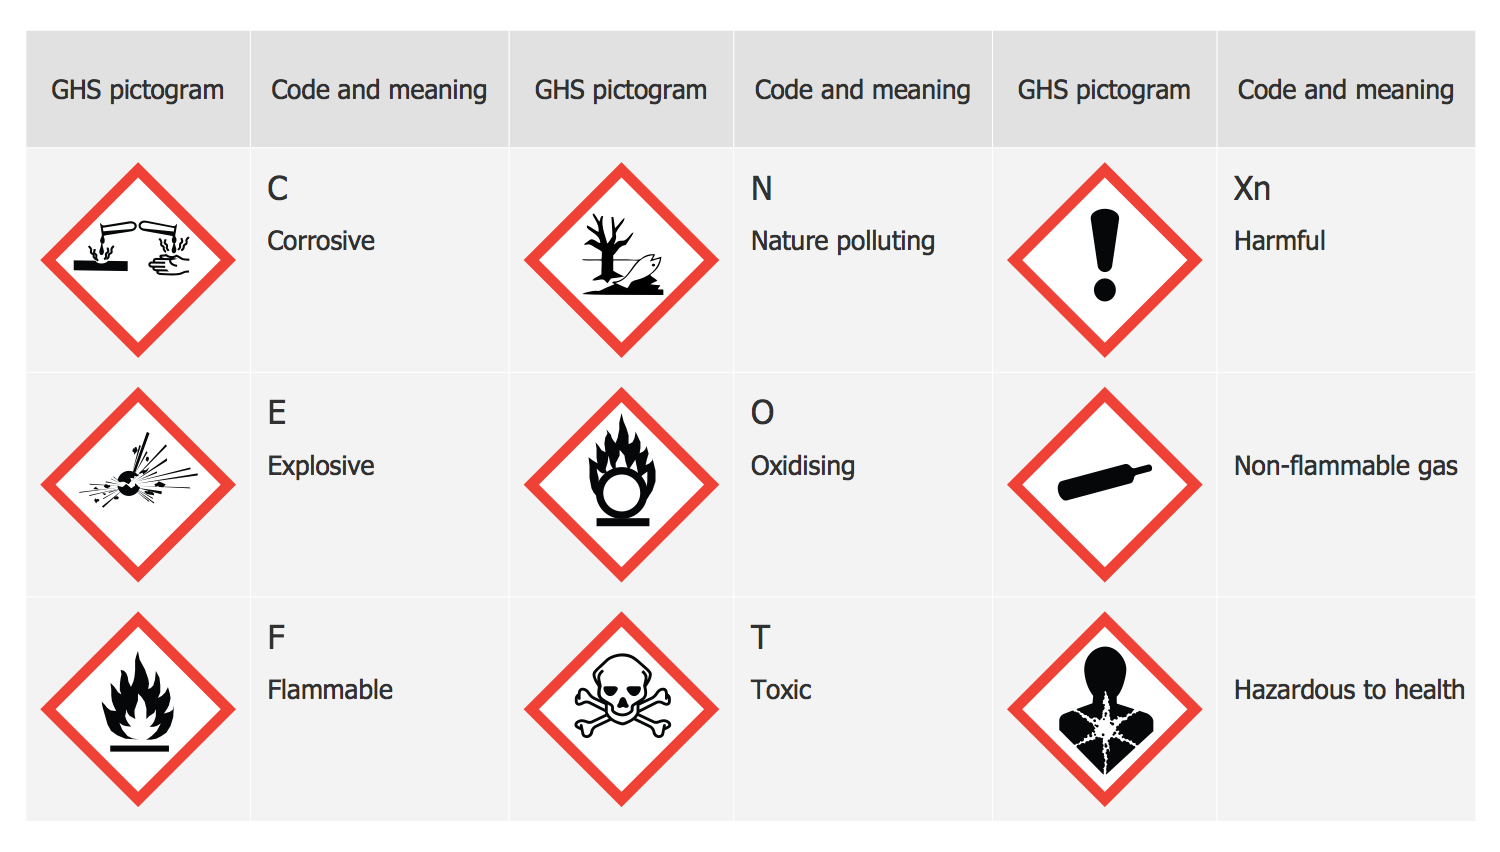
 GHS Hazard Pictograms
GHS Hazard Pictograms solution contains the set of predesigned standard GHS pictograms, Hazardous symbols, and Hazard communication pictograms, approved and agreed by UN in Globally Harmonized System of Classification and Labelling of Chemicals (GHS). They can be used for quick and simple designing accurate and professional-looking infographics, diagrams, warning announcements, signboards, posters, precautionary declarations, regulatory documents, and for representing the main items of OSHA HAZCOM Standard.
 Transport Hazard Pictograms
Transport Hazard Pictograms solution includes large variety of specially developed samples with transport hazard symbols and pictograms, and the whole set of predesigned vector transport GHS pictograms download and used with ease from the Transport Hazard Pictograms library. Apply them for quick designing professional-looking infographics and diagrams, use them to create warning signboards and announcements on all stages of the transportation process, to place them on the transport vehicles and warehouses of transportation companies, at the transport documentation and on the websites of transport and logistics companies.
Winter Sports. Olympic Games Illustrations. Medal Summary
OSHA HAZCOM pictograms
GHS Label Pictograms
The vector stencils library "HR steps" contains 32 HR workflow symbols.
Use this HR icon set to draw your HR flowcharts, workflow diagrams and process charts with the ConceptDraw PRO diagramming and vector drawing software.
The HR pictograms library "HR steps" is included in the HR Flowcharts solution from the Management area of ConceptDraw Solution Park.
Use this HR icon set to draw your HR flowcharts, workflow diagrams and process charts with the ConceptDraw PRO diagramming and vector drawing software.
The HR pictograms library "HR steps" is included in the HR Flowcharts solution from the Management area of ConceptDraw Solution Park.
Accept

Agree

Analyze

Appraisal

Attention
Сheckbox

Checkout

Commit

Grievance procedures

Hand over

Interview

Job analysis

Job offer

Job search

Learning

Log in

Manual filling

Meeting

Pay

Phone interview

Presentation

Problem

Question

Receive

Refuse

Run

Secure payment

Select staff

Shipping

Stop
Synchronization

Video conference

 ConceptDraw Solution Park
ConceptDraw Solution Park collects graphic extensions, examples and learning materials
Data Flow Diagram

- HR professions - Vector stencils library | People | Fault Tree Analysis ...
- GHS Hazard Pictograms | GHS Label Pictograms | Design elements ...
- Management pictograms - Vector stencils library | Management ...
- Competitor Analysis | Human Resource Development | Transport ...
- GHS Hazard Pictograms | Transport Hazard Pictograms | Hazard ...
- Lifestyle analysis - Method of travel to school | Education pictograms ...
- Competitor Analysis | Marketing Analysis Diagram | Mind Maps for ...
- Business people pictograms - Vector stencils library | SWOT ...
- Loss Tree Analysis Example
- Mind Maps for Business - SWOT Analysis | Business people ...
- Block diagram - Porter's five forces model | Competitor Analysis ...
- Import process - Flowchart | Transport Hazard Pictograms | SWOT ...
- Process Flowchart | Lifestyle analysis - Method of travel to school ...
- Stakeholder Mapping Tool | Management pictograms - Vector ...
- GHS Hazard Pictograms | Transport Hazard Pictograms | GHS Label ...
- SWOT Matrix | SWOT Template | Management pictograms - Vector ...
- Import process - Flowchart | SWOT Analysis | Transport Hazard ...
- Management pictograms - Vector stencils library | Marketing ...
- GHS Hazard Pictograms | Circle-Spoke Diagrams | Rapid UML ...
- Business People Figures | Gant Chart in Project Management ...