This line chart sample depicts data from the European Economic Forecast (EUROPEAN ECONOMY 1|2013, Economic and Financial Affairs Winter 2013, European Commission).
[ec.europa.eu/ economy_ finance/ publications/ european_ economy/ 2013/ pdf/ ee1_ en.pdf]
"Exports in France decreased to 36526 EUR Million in October of 2013 from 36637 EUR Million in September of 2013. Exports in France is reported by the Ministère de l'Économie et des Finances. Exports in France averaged 17102.29 EUR Million from 1970 until 2013, reaching an all time high of 37964 EUR Million in August of 2012 and a record low of 1165.60 EUR Million in May of 1970. France is one of the largest exporters of luxury goods and agricultural products in the world. France main exports are: aircrafts (10.1 percent of total exports), food (9.7 percent), chemicals (9.5 percent), industrial machinery (8.3 percent), iron and steel (7.9 percent), electronics (6.7 percent), motor vehicles (6.3 percent) and pharmaceuticals (6.1 percent). Trade outflows to Europe account for 70 percent of total exports. Main export partners are: Germany (16.6 percent of total exports), Italy (8.2 percent), Spain (7.3 percent), Belgium (7.2 percent), the United Kingdom (6.6 percent), the United States (5.6 percent), Netherlands and China. This page contains - France Exports - actual values, historical data, forecast, chart, statistics, economic calendar and news." [tradingeconomics.com/ france/ exports]
The line graph example "France exports of goods and services" was created using ConceptDraw PRO diagramming and vector drawing software extended with Line Graphs solution from Graphs and Charts area of ConceptDraw Solution Park.
Line chart

This flow chart sample was drawn on the base on the illustration of the article "Climate change impact on China food security in 2050" from the website of Chinese Academy of Agricultural Sciences .
[caas.cn/ en/ newsroom/ research_ update/ 67347.shtml]
"Food security is a condition related to the ongoing availability of food. ...
According to the Food and Agriculture Organization (FAO), food security "exists when all people, at all times, have physical and economic access to sufficient, safe and nutritious food to meet their dietary needs and food preferences for an active and healthy life". ...
Extreme events, such as droughts and floods, are forecast to increase as climate change takes hold. Ranging from overnight floods to gradually worsening droughts, these will have a range of impacts on the agricultural sector. ...
According to the Climate & Development Knowledge Network report Managing Climate Extremes and Disasters in the Agriculture Sectors: Lessons from the IPCC SREX Report, the impacts will include changing productivity and livelihood patterns, economic losses, and impacts on infrastructure, markets and food security. Food security in future will be linked to our ability to adapt agricultural systems to extreme events." [Food security. Wikipedia]
The flowchart example "Food security assessment" was created using the ConceptDraw PRO diagramming and vector drawing software extended with the Flowcharts solution from the area "What is a Diagram" of ConceptDraw Solution Park.
Flowchart

Geo Map - USA - Illinois

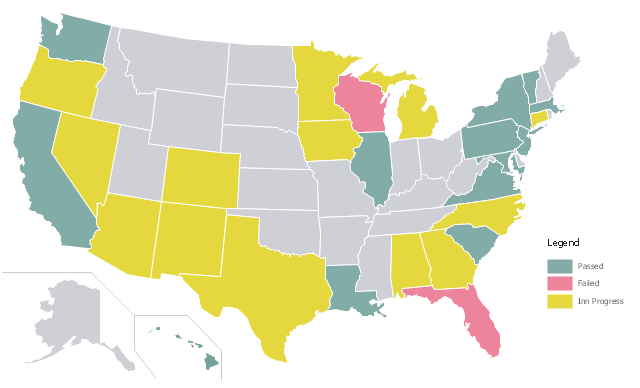
A color-coded map showing US state-by-state status of Benefit Corporation legislation.
"A thematic map is a type of map or chart especially designed to show a particular theme connected with a specific geographic area. These maps "can portray physical, social, political, cultural, economic, sociological, agricultural, or any other aspects of a city, state, region, nation, or continent"." [Thematic map. Wikipedia]
This U.S.A. thematic map was redesigned from Wikipedia file: Benefit Corporation Map 2012 05 16.svg. [commons.wikimedia.org/ wiki/ File:Benefit_ Corporation_ Map_ 2012_ 05_ 16.svg]
This file is licensed under the Creative Commons Attribution-Share Alike 3.0 Unported license.
[creativecommons.org/ licenses/ by-sa/ 3.0/ deed.en]
This U.S. thematic map example was created using the ConceptDraw PRO diagramming and vector drawing software extended with the Continent Maps solution from the Maps area of ConceptDraw Solution Park.
Thematic map of U.S.
- Flow Chart Showing Agriculture Practice
- Bar Diagrams for Problem Solving. Create economics and financial ...
- Sector weightings - Exploded pie chart | Bar Diagrams for Problem ...
- Sector diagram - Template | Economic sector weightings | Domestic ...
- Economic Graphs
- Food security assessment - Flowchart | Flowcharts | Contoh ...
- Economic Application Of Graph And Lines
- Food security assessment - Flowchart | Opportunities in agro and ...
- Marketing Diagrams | Pictorial Graph Based On Agri
- Chart Examples | Sales Growth. Bar Graphs Example | Chart ...
- France exports of goods and services - Line graph | How to Create a ...
- Flow Chart Of Security
- Process Flowchart | Types of Flowcharts | France exports of goods ...
- Food security assessment - Flowchart | Weather - Vector stencils ...
- Ecosystem goods and services - Segmented pyramid diagram ...
- Organizational Charts | ConceptDraw Solution Park | 25 Typical ...
- Percent of Students achieved a 36 on ACT | How to Draw the ...
- Basic Flowchart Symbols and Meaning | Cross-Functional Flowchart ...
- Line Graphs
- Line Graphs | Line Graph Charting Software | How to Draw a Line ...