Activity on Node Network Diagramming Tool

Activity Network Diagram Method

Activity Network (PERT) Chart

ConceptDraw DIAGRAM Network Diagram Tool


Network Topologies

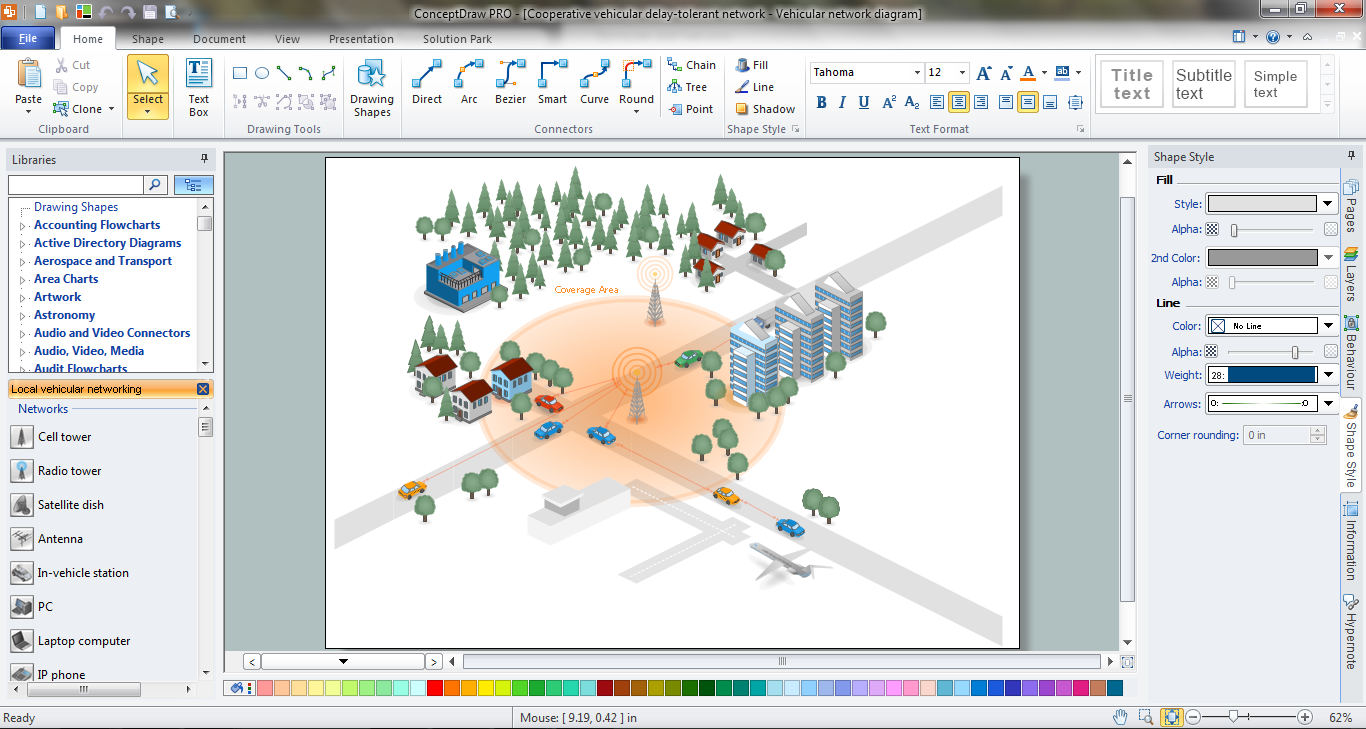
Vehicular Network
 Telecommunication Network Diagrams
Telecommunication Network Diagrams solution extends ConceptDraw DIAGRAM software with samples, templates, and great collection of vector stencils to help the specialists in a field of networks and telecommunications, as well as other users to create Computer systems networking and Telecommunication network diagrams for various fields, to organize the work of call centers, to design the GPRS networks and GPS navigational systems, mobile, satellite and hybrid communication networks, to construct the mobile TV networks and wireless broadband networks.
IDEF0 standard with ConceptDraw DIAGRAM

The PERT chart shows the logical connections and consequence of a set of tasks. PERT charts the time period for problem solving and the implementation plan for all activities along the critical path. The PERT chart is also known as a precedence diagram or project network diagram.
"The Program (or Project) Evaluation and Review Technique, commonly abbreviated PERT, is a statistical tool, used in project management, that is designed to analyze and represent the tasks involved in completing a given project. ...
PERT is a method to analyze the involved tasks in completing a given project, especially the time needed to complete each task, and to identify the minimum time needed to complete the total project.
PERT was developed primarily to simplify the planning and scheduling of large and complex projects. ...
A network diagram can be created by hand or by using diagram software. There are two types of network diagrams, activity on arrow (AOA) and activity on node (AON). Activity on node diagrams are generally easier to create and interpret." [Program Evaluation and Review Technique. Wikipedia]
The PERT chart is one of the Seven Management and Planning Tools (7 MP tools, Seven New Quality Tools).
The PERT chart template for the ConceptDraw PRO diagramming and vector drawing software is included in the solution "Seven Management and Planning Tools" from the Management area of ConceptDraw Solution Park.
PERT chart template

Legend

Network Engineering
 ATM UML Diagrams
The ATM UML Diagrams solution lets you create ATM solutions and UML examples. Use ConceptDraw DIAGRAM as a UML diagram creator to visualize a banking system.
 Vehicular Networking
The Vehicular Networking solution extends the ConceptDraw DIAGRAM software functionality with specialized tools, wide variety of pre-made vector objects, collection of samples and templates in order to help network engineers design vehicular network diagrams for effective network engineering activity, visualize vehicular networks, develop smart transportation systems, design various types of vehicle network management diagrams, regional network diagrams, vehicular communication system diagrams, vehicular ad-hoc networks, vehicular delay-tolerant networks, and other network engineering schemes.
Network Concepts

HelpDesk
How to Create an IDEF0 Diagram for an Application Development

 Rapid UML
Rapid UML solution extends ConceptDraw DIAGRAM software with templates, samples and libraries of vector stencils for quick drawing the UML diagrams using Rapid Draw technology.
- Activity Network (PERT) Chart | Activity Network Diagram Method ...
- Activity Network Diagram Method | Process Flowchart | Activity ...
- PERT Chart Software | Activity Network (PERT) Chart | Activity ...
- Process Flowchart | Activity on Node Network Diagramming Tool ...
- Activity Network Diagram Method | ConceptDraw PRO Network ...
- Activity Network (PERT) Chart | PERT Chart Software | Activity ...
- Activity Network (PERT) Chart | Affinity Diagram Software | Activity ...
- Examples of Flowcharts, Org Charts and More | Activity Network ...
- Activity Network (PERT) Chart | PERT Chart Software | Decision ...
- CORRECTIVE ACTIONS PLANNING. PERT Chart | Activity Network ...
- Activity on Node Network Diagramming Tool | Network Analysis ...
- Activity Network Diagram Software
- Activity on Node Network Diagramming Tool | Activity Network ...
- Activity Network Diagram Method | PERT Chart Software | Product ...
- Activity Network (PERT) Chart | Best Flowchart Software | Network ...
- Activity Network Diagram Method | Activity on Node Network ...
- Activity Network (PERT) Chart | PERT chart - Template | How To ...
- PERT Chart Software | Activity Network (PERT) Chart | Program ...
- Activity Network (PERT) Chart | Process Flowchart | Flow chart ...
- Activity Network (PERT) Chart | Examples of Flowcharts, Org Charts ...