Basic Diagramming Flowchart Software

Histogram Chart

 Bar Graphs
The Bar Graphs solution enhances ConceptDraw DIAGRAM functionality with templates, numerous professional-looking samples, and a library of vector stencils for drawing different types of Bar Graphs, such as Simple Bar Graph, Double Bar Graph, Divided Bar Graph, Horizontal Bar Graph, Vertical Bar Graph, and Column Bar Chart.
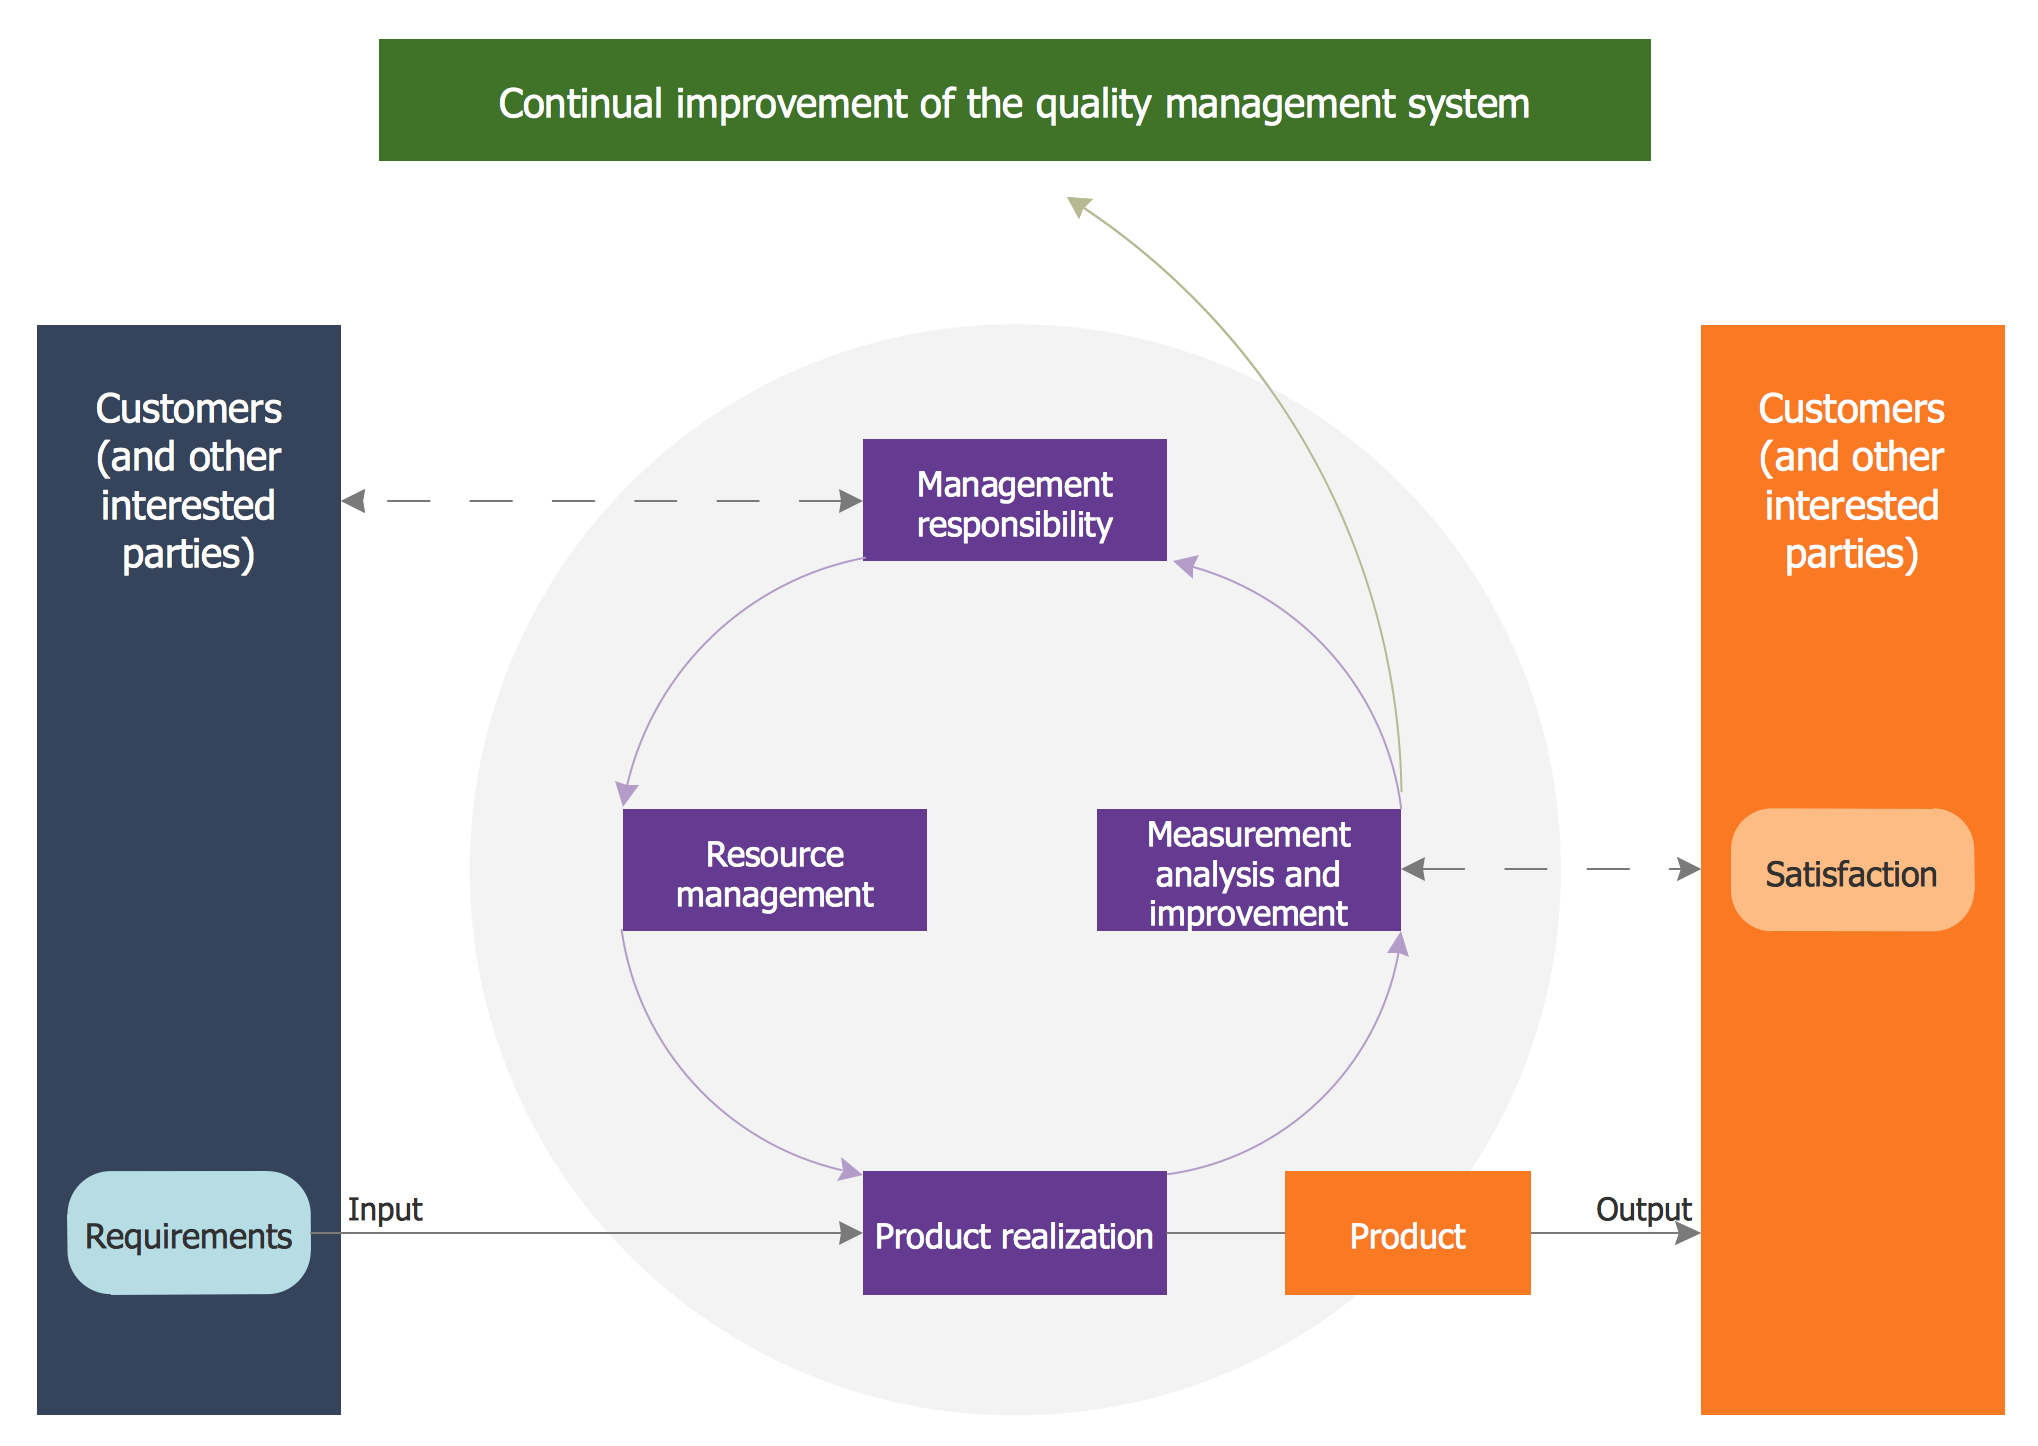
Quality Management System
Sales Process

 Biology
Biology solution extends ConceptDraw DIAGRAM software with samples, templates and libraries containing biological vector symbols, to help you create scientific and educational designs in the field of biology.
Biology Drawing Software

How To Make a Histogram?

This process flow diagram (PFD) example shows an amine treating system for the removal of gaseous hydrogen sulfide from gas streams. It is used in oil refineries and chemical plants. This PFD sample was redesigned from the Wikimedia Commons file: AmineTreating.png. [commons.wikimedia.org/ wiki/ File:AmineTreating.png]
This file is licensed under the Creative Commons Attribution-Share Alike 3.0 Unported license. [creativecommons.org/ licenses/ by-sa/ 3.0/ deed.en]
"Amine gas treating, also known as gas sweetening and acid gas removal, refers to a group of processes that use aqueous solutions of various alkylamines (commonly referred to simply as amines) to remove hydrogen sulfide (H2S) and carbon dioxide (CO2) from gases. It is a common unit process used in refineries, and is also used in petrochemical plants, natural gas processing plants and other industries.
Processes within oil refineries or chemical processing plants that remove hydrogen sulfide are referred to as "sweetening" processes because the odor of the processed products is improved by the absence of hydrogen sulfide. An alternative to the use of amines involves membrane technology. Membranes are attractive since no reagents are consumed.
Many different amines are used in gas treating:
Diethanolamine (DEA),
Monoethanolamine (MEA),
Methyldiethanolamine (MDEA),
Diisopropanolamine (DIPA),
Aminoethoxyethanol (Diglycolamine) (DGA).
The most commonly used amines in industrial plants are the alkanolamines DEA, MEA, and MDEA. These amines are also used in many oil refineries to remove sour gases from liquid hydrocarbons such as liquified petroleum gas (LPG)." [Amine gas treating. Wikipedia]
The PFD example "Amine treating unit schematic diagram" was drawn using the ConceptDraw PRO diagramming and vector drawing software extended with the Chemical and Process Engineering solution from the Chemical and Process Engineering area of ConceptDraw Solution Park.
Process Flow Diagram (PFD)
-amine-treating-unit-schematic-diagram.png--diagram-flowchart-example.png)
Physics Symbols

 GHS Hazard Pictograms
GHS Hazard Pictograms solution contains the set of predesigned standard GHS pictograms, Hazardous symbols, and Hazard communication pictograms, approved and agreed by UN in Globally Harmonized System of Classification and Labelling of Chemicals (GHS). They can be used for quick and simple designing accurate and professional-looking infographics, diagrams, warning announcements, signboards, posters, precautionary declarations, regulatory documents, and for representing the main items of OSHA HAZCOM Standard.
Business Diagram Software


Chemical Engineering

Chemistry Drawing Software
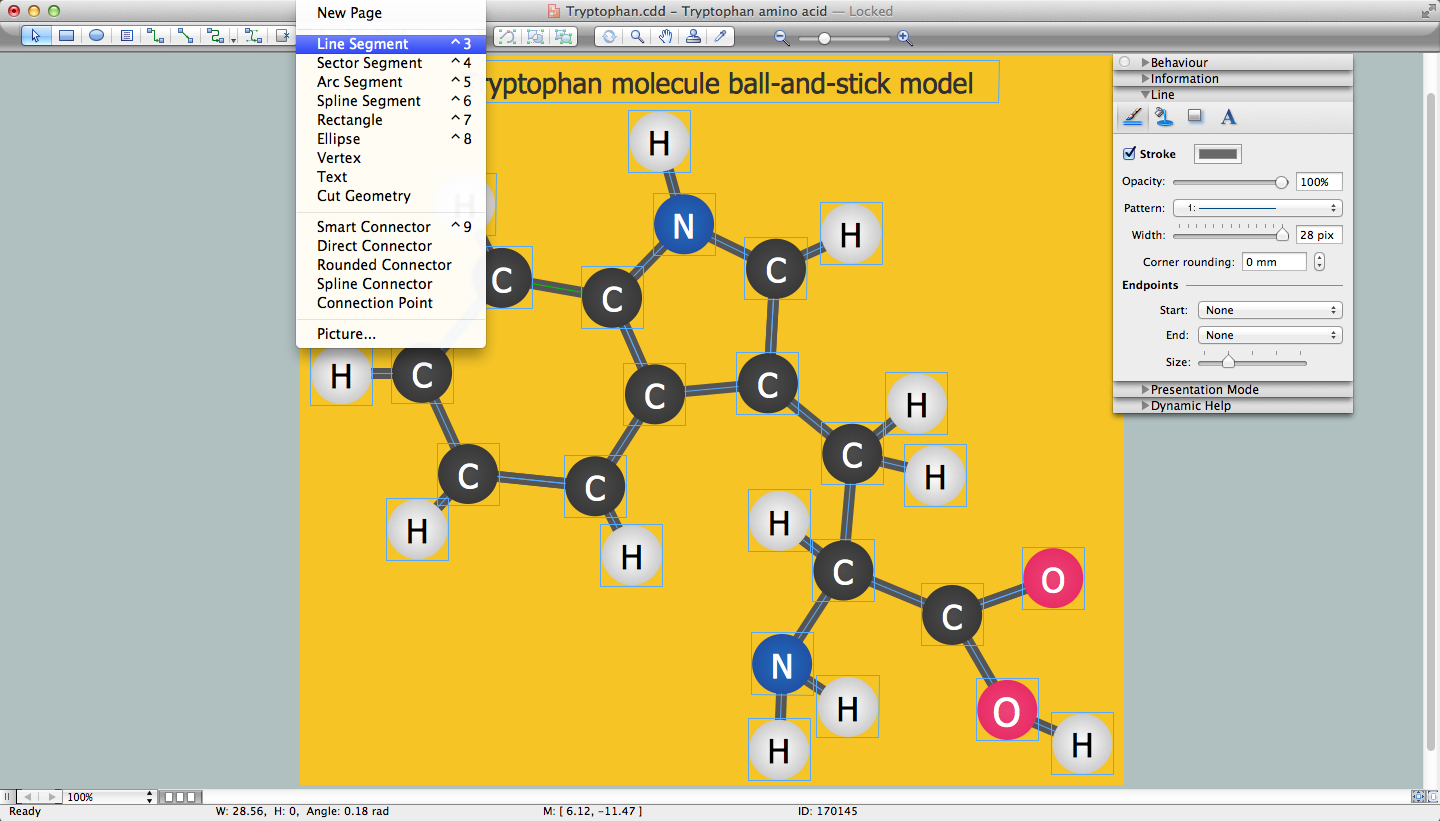
 Chemistry
This solution extends ConceptDraw DIAGRAM software with samples, template and libraries of vector stencils for drawing the Chemistry Illustrations for science and education.
- Simple Flow Chart For Citric Acid
- Citric Acid Cycle Diagram
- Biology Symbols | Basic Diagramming Flowchart Software | Nature ...
- Basic Diagramming Flowchart Software | Sales Process | Physics ...
- Design elements - TCA cycle | Basic Diagramming Flowchart ...
- Nature Drawings - How to Draw | Acid Rain Flow Diagram
- Basic Diagramming Flowchart Software | Sales Process | Biology ...
- Simple Flow Chart Drawing Of The Formation Of Citric Acid
- Basic Diagramming Flowchart Software | Sales Process | Biology ...
- Basic Diagramming Flowchart Software | Sales Process | Biology ...
- Citric acid cycle (TCA cycle) | Basic Diagramming Flowchart ...
- Biology Symbols | Basic Diagramming Flowchart Software | Biology ...
- Flow Sheet Diagram Of Citric Acid Production
- Basic Diagramming Flowchart Software | Biology Drawing Software ...
- Basic Diagramming Flowchart Software | Design elements - TCA ...
- Process Flowchart | Data Flow Diagram Model | Flow chart Example ...
- Citric Acid Cycle Text Flowchart
- Glycolysis Cycle Diagram Simple
- Basic Diagramming Flowchart Software | Biology Symbols ...
- Metabolism Of Proteins In Flow Chart