How to Create a Pie Chart

Material Requisition Flowchart. Flowchart Examples

 Rapid UML
Rapid UML solution extends ConceptDraw DIAGRAM software with templates, samples and libraries of vector stencils for quick drawing the UML diagrams using Rapid Draw technology.
The vector stencils library "Scrum workspace" contains 21 icons.
Use this clipart set to design your agile software development diagrams and infographics with ConceptDraw PRO software.
"... a list of all the things that ... should be visible within the ideal agile workspace:
Big Visible Charts. ... the sprint burndown chart, showing the number of hours remaining as of each day of the current sprint. ... big visible charts showing the number of passing customer acceptance tests, the pass/ fail status of tests by day, sprint and release burndown charts, number of new stories introduced to the product backlog per sprint, and more.
Additional feedback devices. In addition to big, visible charts, it is common for an agile team to use additional visual feedback devices in their workspace. One of the most common is a lava lamp that is turned on whenever the automated build is broken.
... flashing red traffic lights to indicate exceptional conditions such as an issue on a production server. Also popular are ambient orbs and Nabaztag rabbits, which are wireless programmable devices that can also be configured to change colors, speak messages, or wiggle their ears as a team desires. ...
Everyone on your team. Each person on the team should ideally be able to see each other person on the team. This absolutely includes the ScrumMaster and ideally includes the product owner. ...
The sprint backlog. One of the best ways to ensure that everything necessary is completed in the sprint is to make the sprint backlog visible. The best way to do that is by displaying the sprint backlog on a wall, ideally in the form of a task board ...
The product backlog. One problem with running an endless series of sprints is that each can feel disconnected or isolated from the whole of a planned released or related set of new capabilities. A good way to reduce the impact of this problem is by displaying the product backlog somewhere clearly visible. ... tack the index cards with those upcoming user stories on a wall where all can see them. This allows team members to see how the user stories they are working on in the current sprint relate to others that are coming soon.
At least one big white board. ... Locating this in the team’s common workspace encourages spontaneous meetings." [mountaingoatsoftware.com/ blog/ the-ideal-agile-workspace]
The clip art sample "Design elements - Scrum workspace" is included in the Scrum solution from the Project Management area of ConceptDraw Solution Park.
Icon set
This agile software development infographic example was inspired by Mike Cohn's post "The Ideal Agile Workspace" from the Mountain Goat Software blog.
"... a list of all the things that ... should be visible within the ideal agile workspace:
* Big Visible Charts. ... the sprint burndown chart, showing the number of hours remaining as of each day of the current sprint. ... big visible charts showing the number of passing customer acceptance tests, the pass/ fail status of tests by day, sprint and release burndown charts, number of new stories introduced to the product backlog per sprint ...
* Additional feedback devices. ... a lava lamp that is turned on whenever the automated build is broken. ... flashing red traffic lights to indicate exceptional conditions such as an issue on a production server. ... ambient orbs and Nabaztag rabbits, which are wireless programmable devices that can also be configured to change colors, speak messages, or wiggle their ears as a team desires.
* Everyone on your team. Each person on the team should ideally be able to see each other person on the team. ...
* The sprint backlog. ... The best way to do that is by displaying the sprint backlog on a wall, ideally in the form of a task board A task board is usually oriented in rows and columns with each row containing a particular user story and one index card or sticky note for each task involved in that story. Task cards are organized in columns, minimally including “To Do” “In Process,” and “Done.” ...
* The product backlog. ... tack the index cards with those upcoming user stories on a wall where all can see them. ...
* At least one big white board. ...
* Someplace quiet and private. ...
* Food and drink. ...
* A window." [mountaingoatsoftware.com/ blog/ the-ideal-agile-workspace].
The infographic sample "Scrum workspace" was created using the ConceptDraw PRO software extended with the Scrum solution from the Project Management area of ConceptDraw Solution Park.
Infographic
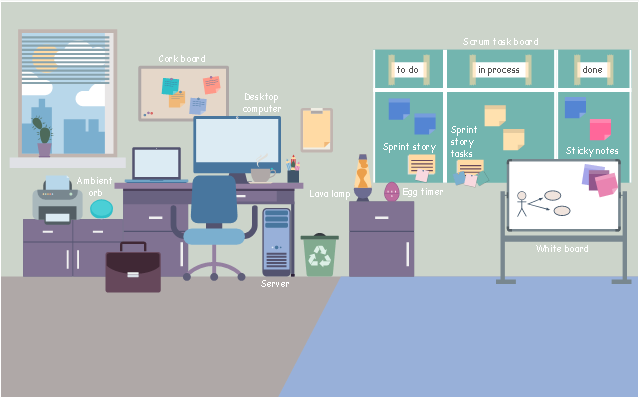
Chart Examples

Flow Chart Creator
Gane Sarson Diagram

Probability Quality Control Tools

Geo Map — Africa — Tanzania

- Scrum Workflow | Scrum sprint cycle | Scrum workspace | Agile ...
- Scrum Workflow | Agile Mind Maps: Exploring the User Wishes ...
- Design elements - Scrum workspace | Office - Design Elements ...
- Design elements - Scrum workspace | Cisco Network Topology ...
- Scrum To Do Icons
- User Story Card Elements
- Scrum workflow | Scrum | Scrum process work items and workflow ...
- Scrum sprint cycle | Scrum | Scrum workspace | Scrum Infographic
- Status Dashboard | Road Transport - Design Elements | Aerospace ...
- SSADM Diagram | Design elements - Scrum people | Scrum board ...