Stakeholder Management System

Visualize Stakeholder Analysis

Stakeholder Onion Diagrams

 Stakeholder Onion Diagrams
The Stakeholder Onion Diagram is often used as a way to view the relationships of stakeholders to a project goal. A basic Onion Diagram contains a rich information. It shows significance of stakeholders that will have has influence to the success achieve
Stakeholder Mapping Tool

Stakeholder Onion Diagram Template

 ConceptDraw Solution Park
ConceptDraw Solution Park collects graphic extensions, examples and learning materials
The Circular Flow Diagram

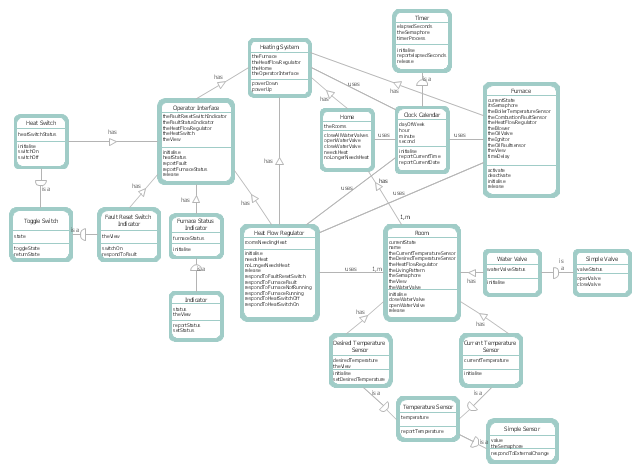
This DFD sample was created on the base of the figure illustrating "A Survey of Object-Oriented Methods" by Peter Biggs from University of Durham.
[students.cs.byu.edu/ ~pbiggs/ images/ coadsys.gif]
"Object-oriented analysis and design (OOAD) is a popular technical approach to analyzing, designing an application, system, or business by applying the object-oriented paradigm and visual modeling throughout the development life cycles to foster better stakeholder communication and product quality.
According to the popular guide Unified Process, OOAD in modern software engineering is best conducted in an iterative and incremental way. Iteration by iteration, the outputs of OOAD activities, analysis models for OOA and design models for OOD respectively, will be refined and evolve continuously driven by key factors like risks and business values." [Object-oriented analysis and design. Wikipedia]
The DFD example "Coad/ Yourdon's Object-Oriented Analysis model" was created using the ConceptDraw PRO diagramming and vector drawing software extended with the Data Flow Diagrams solution from the Software Development area of ConceptDraw Solution Park.
DFD
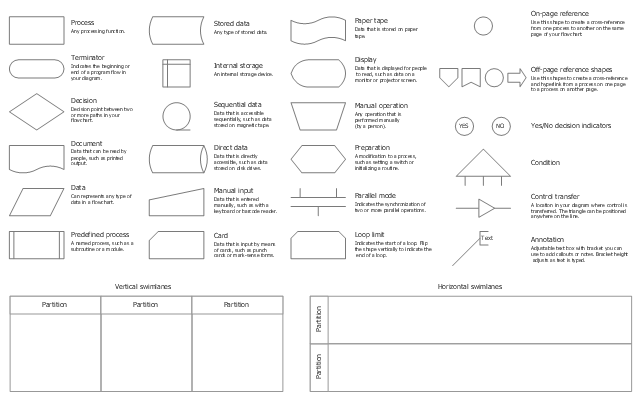
The vector stencils library "Cross-functional flowcharts" contains 31 symbols for creating the deployment flow charts using the ConceptDraw PRO diagramming and vector drawing software.
"A deployment flowchart (sometimes referred to as a "cross functional flowchart") is a business process mapping tool used to articulate the steps and stakeholders of a given process. ...
As deployment flowcharts highlight the relationships between stakeholders in addition to the process flow they are especially useful in highlighting areas of inefficiency, duplication or unnecessary processing. Often utilized within Six sigma activity, completed flowcharts are commonly used to examine the interfaces between “participants” which are typically causes for delays and other associated issues. Deployment flowcharts are useful for determining who within an organization is required to implement a process and are sometimes used as a business planning tool." [Deployment flowchart. Wikipedia]
The example "Design elements - Cross-functional flowcharts" is included in the Cross-Functional Flowcharts solution from the Business Processes area of ConceptDraw Solution Park.
Cross-functional flowchart shapes
Network Diagram Software. LAN Network Diagrams. Physical Office Network Diagrams


This circular diagram sample was created on the base of the figure from the Florence-Darlington Technical College website. [bus.fdtc.edu/ sbed/ core/ core7.html]
"A marketing plan may be part of an overall business plan. Solid marketing strategy is the foundation of a well-written marketing plan. While a marketing plan contains a list of actions, a marketing plan without a sound strategic foundation is of little use. ...
A marketing plan for a small business typically includes Small Business Administration Description of competitors, including the level of demand for the product or service and the strengths and weaknesses of competitors:
(1) Description of the product or service, including special features.
(2) Marketing budget, including the advertising and promotional plan.
(3) Description of the business location, including advantages and disadvantages for marketing.
(4) Pricing strategy.
(5) Market Segmentation." [Marketing plan. Wikipedia]
The circular diagram example "Marketing plan" was created using the ConceptDraw PRO diagramming and vector drawing software extended with the Target and Circular Diagrams solution from the Marketing area of ConceptDraw Solution Park.
www.conceptdraw.com/ solution-park/ marketing-target-and-circular-diagrams
Circular diagram

- How To Draw Stakeholder Onion Diagram
- Visualize Stakeholder Analysis | Onion Diagram Maker ...
- Stakeholder Onion Diagram Template
- Onion Diagram Process Design | Stakeholder Onion Diagrams ...
- Conceptdraw.com: Mind Map Software, Drawing Tools | Project ...
- How To Create Onion Diagram | Stakeholder Onion Diagram ...
- Management Stakeholder Onion Diagrams
- Stakeholder Management System
- System Stakeholders Diagram
- Stakeholder Icons
- How To Create Stakeholder Onion Diagram
- Stakeholder Mapping Tool | Stakeholder Onion Diagram Template ...
- Stakeholder Onion Diagrams | How To Create Onion Diagram ...
- Round Onion Diagram Template
- Stakeholder Onion Diagrams
- Target diagrams - Vector stencils library | Target diagrams - Vector ...
- Onion Diagram Templates | Stakeholder Onion Diagram Template ...
- Elliptical Onion Diagram Template
- Stakeholder Onion Diagrams | Pie Charts | Target and Circular ...
- Target diagrams - Vector stencils library | Target diagrams - Vector ...