This site uses cookies. By continuing to browse the ConceptDraw site you are agreeing to our Use of Site Cookies.

Flow Chart Creator

ConceptDraw DIAGRAM is a flowchart design software. There are large collections of professional flowchart symbols for process flow diagrams, standard flowchart symbols and colored basic flowchart symbols. Built-in examples and video lessons allow users to get started immediately and do drawing of virtually any type of flowchart or process flow diagrams

3 Circle Venn Diagram. Venn Diagram Example

This template shows the Venn Diagram. It was created in ConceptDraw DIAGRAM diagramming and vector drawing software using the ready-to-use objects from the Venn Diagrams Solution from the "Diagrams" area of ConceptDraw Solution Park.
Venn Diagrams visualize all possible logical intersections between several sets and are widely used in mathematics, logic, statistics, marketing, sociology, etc.

How To Create a Flow Chart in ConceptDraw

ConceptDraw DIAGRAM is a flowchart creating software. This software includes over 20 vector stencils in libraries. These objects allow you to create well-designed flowcharts.
Put an initial object from library to a page and use RapidDraw technology clicking on direction arrows to add new objects to the flowchart. This way you can make flowchart quickly.

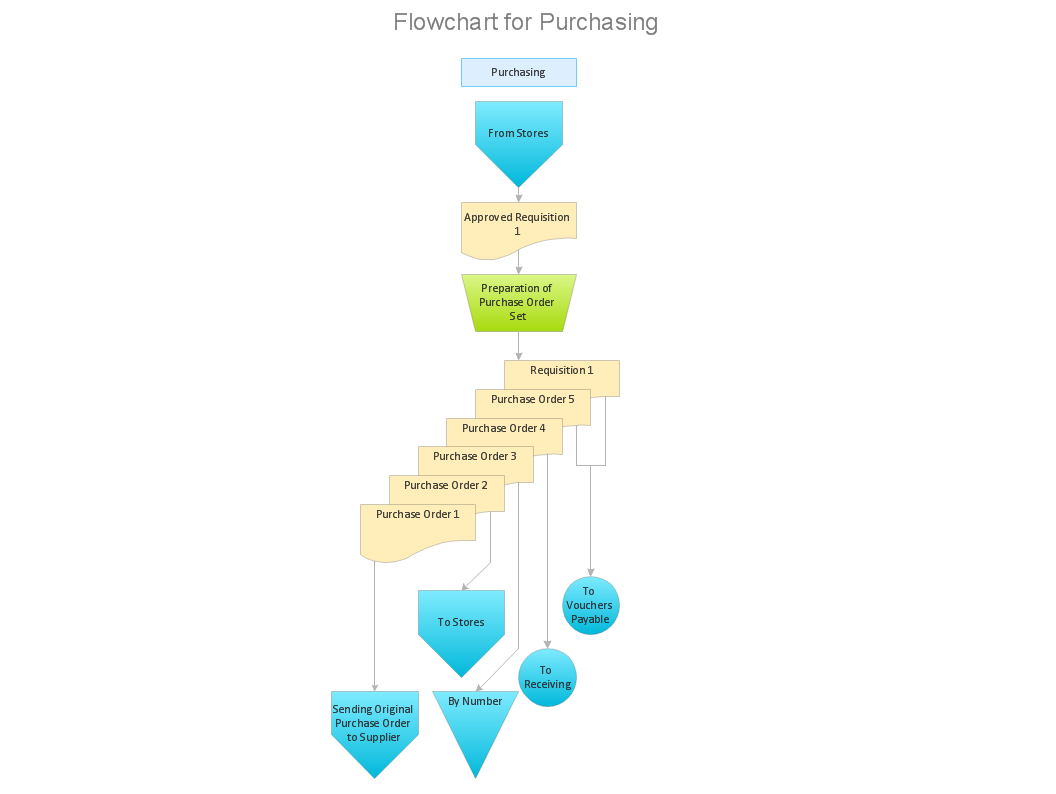
Introduction to bookkeeping: Accounting flowchart process

Everything about Bookkeeping: Accounting flowchart process. Which symbols to use, how to make a chart.

Flowchart Software

To design the professional looking Flowchart Diagrams use ConceptDraw DIAGRAM diagramming and vector drawing software extended with Flowchart maker solutions from the Diagrams area of ConceptDraw Solution Park.
The Flowcharts diagrams are widely used for designing, documenting, analyzing and managing the complex processes and programs in various fields such as business, engineering, architecture, science, manufacturing, administration, etc.

Business diagrams & Org Charts with ConceptDraw DIAGRAM

Business flowcharting tool helps you create a flowchart with minimal effort. With ConceptDraw you can make a flowchart, draw data flow diagrams, orgchart professional, process flow diagrams etc - without any prior knowledge or training.
Draw Business Process Diagrams
HelpDesk

How to Create a Venn Diagram

Venn diagrams were invented by John Venn as a method of depicting relationships between different components. A Venn diagram consists of two or more circles. Each circle represents a specific group or set. The entities which are depicted by circles generally have some common characteristics. A Venn Diagram shows all the possible logical relations between these entities. Any properties that belong to more than one set should be indicated in the sections where the circles overlap. A Venn Diagram can be useful to visually summarize the status and future viability of a project. ConceptDraw DIAGRAM allows you to make Venn diagrams using the Venn Diagrams solution.

Venn Diagram Template

It's impossible to overestimate the usefulness and convenience of using the ready templates when you create your own diagrams and charts. And Venn Diagrams are not exception. ConceptDraw DIAGRAM diagramming and vector drawing software presents the Venn Diagrams solution from "Diagrams" area which offers a set of Venn Diagram templates and samples. Use the suitable Venn Diagram Template to create your own Venn Diagram of any complexity.

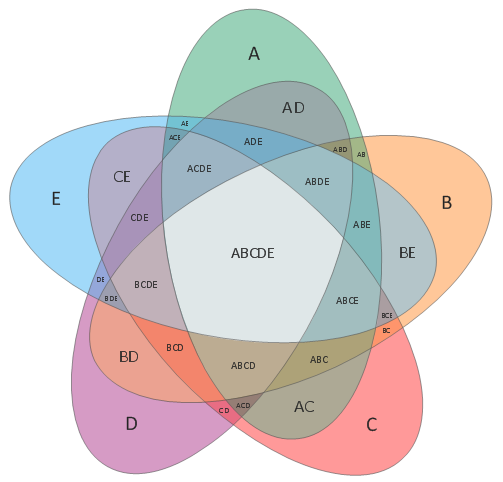
Venn Diagram Examples for Problem Solving. Venn Diagram as a Truth Table

Venn diagrams are illustrations used in the branch of mathematics known as set theory. They show the mathematical or logical relationship between different groups of things (sets). A Venn diagram shows all the possible logical relations between the sets.

How to Simplify Flow Charting — Cross-functional Flowchart

In ConceptDraw DIAGRAM it really is sp simple to draw even the most complex cross-functional flowcharts. Use the RapidDraw technology and Cross-Functional libraries in ConceptDraw DIAGRAM for the best results.

3 Circle Venn. Venn Diagram Example

This example shows the 3 Circle Venn Diagram. The Venn Diagrams visualize all possible logical intersections between several sets. On this example you can see the intersections of 3 sets. Venn Diagrams are widely used in mathematics, logic, statistics, marketing, sociology, etc.

Easy Flowchart Program and Standard Flowchart Symbols

Fast visualization of structured data is main capability of the ConceptDraw DIAGRAM. With numerous vector stencils and standard flowchart symbols from object libraries and the RapidDraw technology this program stands as the best professional flowchart software for drawing with type of flowchart symbols. ConceptDraw DIAGRAM also known as best flowchart maker.

Account Flowchart. Flowchart Examples

Create your own flow charts of computer or network system account processing using the ConceptDraw DIAGRAM diagramming and vector drawing software extended with the Cross-Functional Flowcharts solution from the Business Processes area of ConceptDraw Solution Park.
The flow chart example shows the computer network system account processing.