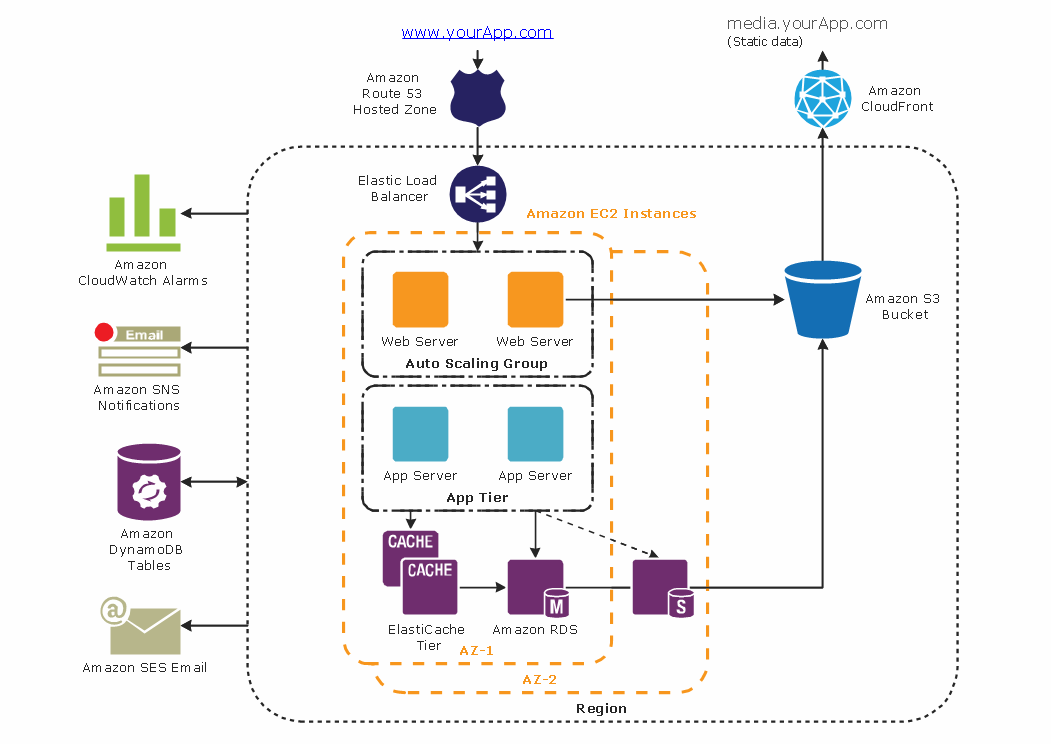
Diagrams of any complexity can be produced. This 3-tier diagram shows the core network backbone, the distribution layer, and the access layer. Creating a diagram is a dynamic process, and items can be easily added or withdrawn from the network as necessary.
This diagram was created in ConceptDraw DIAGRAM using the AWS Architecture Diagram library from the Amazon Web Services Architecture Diagrams solution (AWS solution).
ConceptDraw DIAGRAM provides export of vector graphic multipage documents into multiple file formats: vector graphics (SVG, EMF, EPS), bitmap graphics (PNG, JPEG, GIF, BMP, TIFF), web documents (HTML, PDF), PowerPoint presentations (PPT), Adobe Flash (SWF).
See also:
Diagramming software for Amazon Web Service
Diagrams, charts, schemes, symbols and icons
AWS Simple Icons for Architecture Diagrams
Diagramming for Amazon Web Services architecture - Design Elements and Icons
Samples
Network Diagrams — AWS Architecture
NINE RELATED HOW TO's:
DataBase icons - Amazon AWS pro diagrams - AWS diagrams are part of architecturing tools provided with ConceptDraw Solution Park.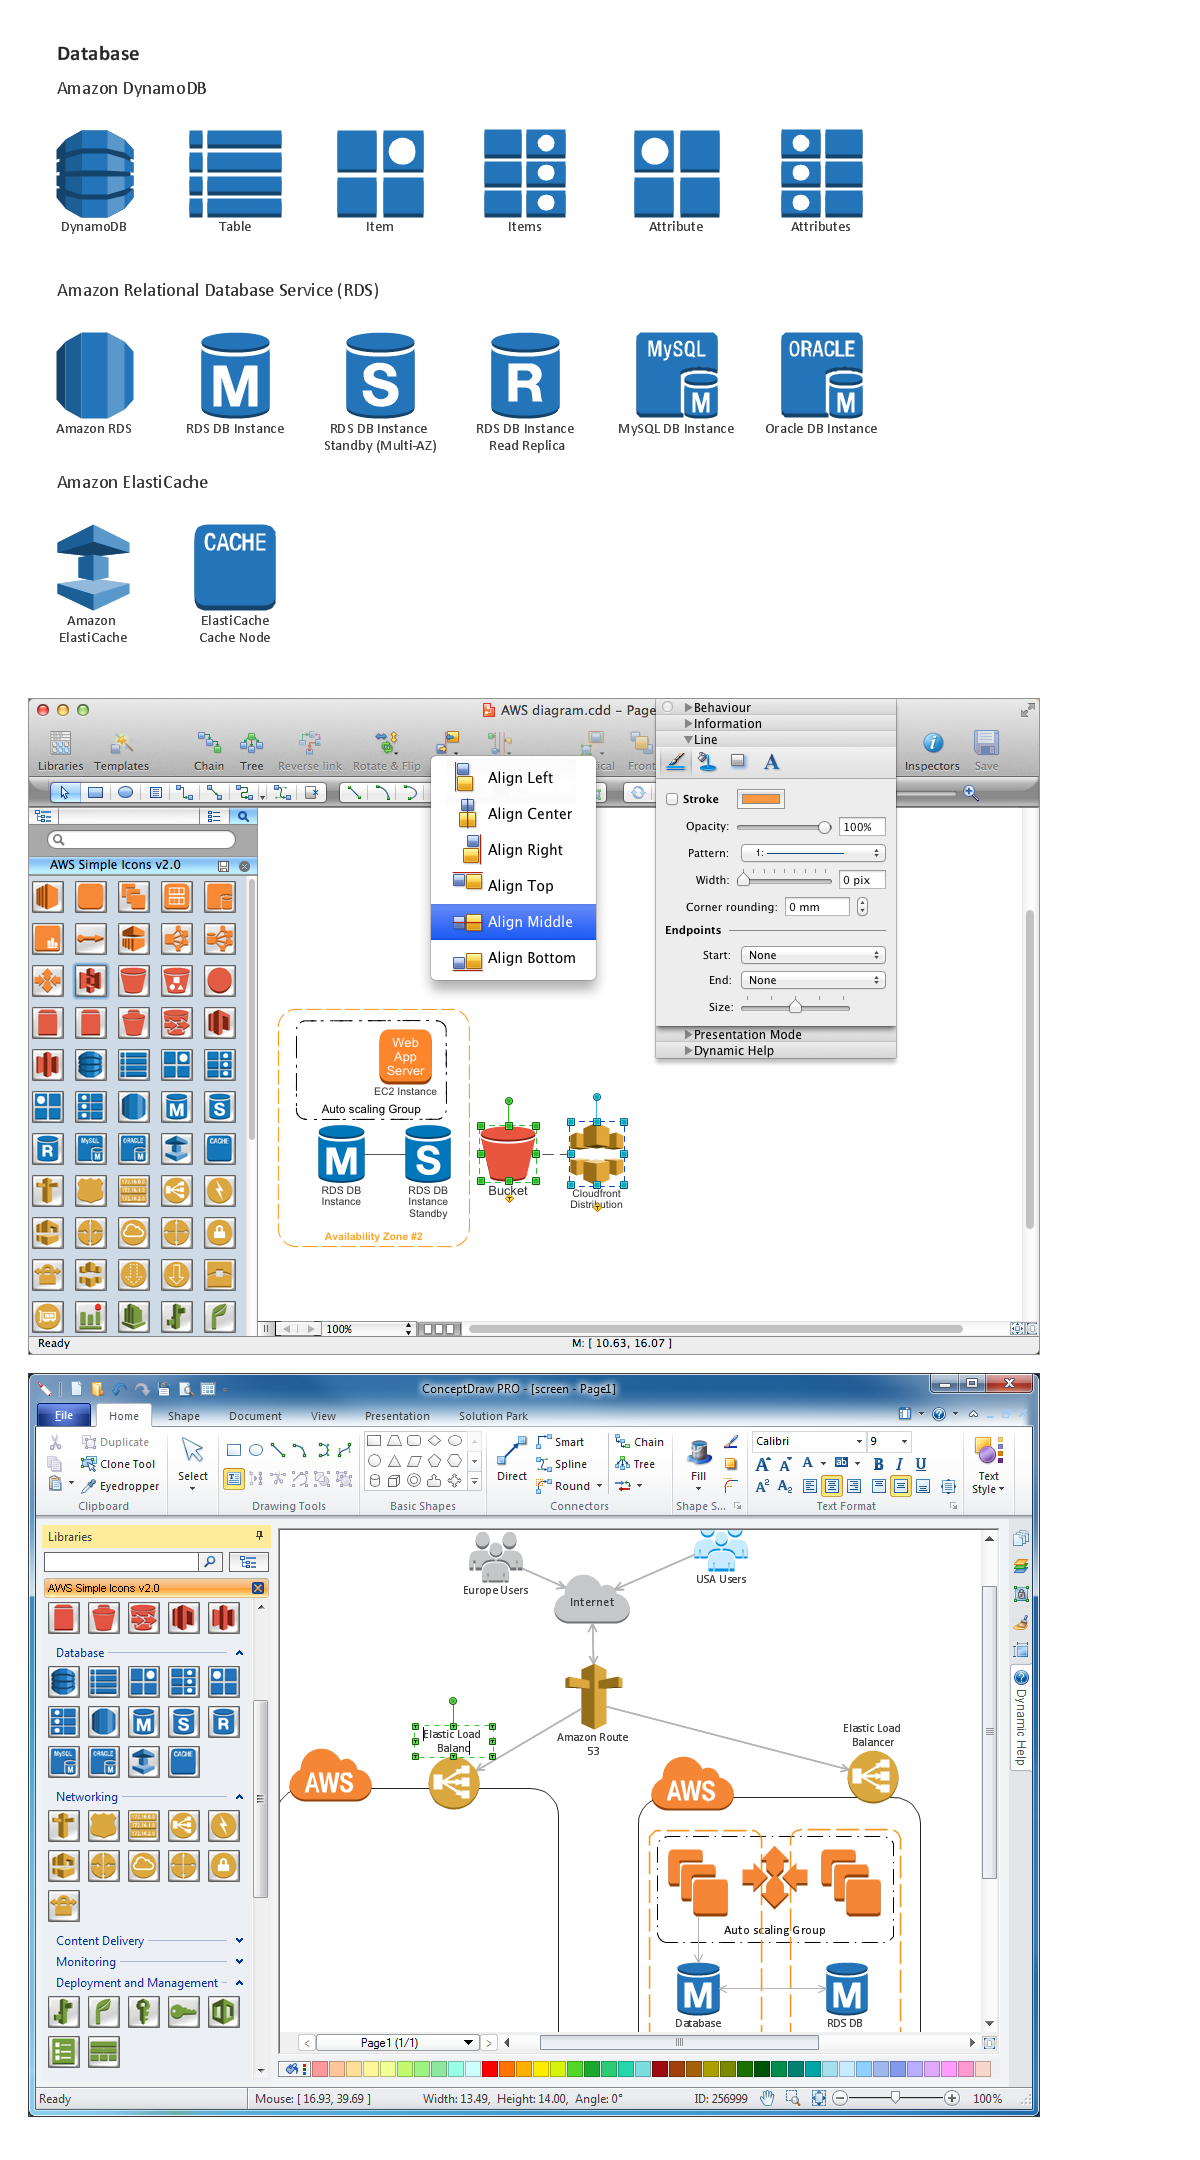
Picture: Diagramming software for Amazon Web Service icon set: Data Base
Networking and Content Delivery icons - Amazon AWS pro diagrams - AWS diagrams are part of architecturing tools provided with ConceptDraw Solution Park.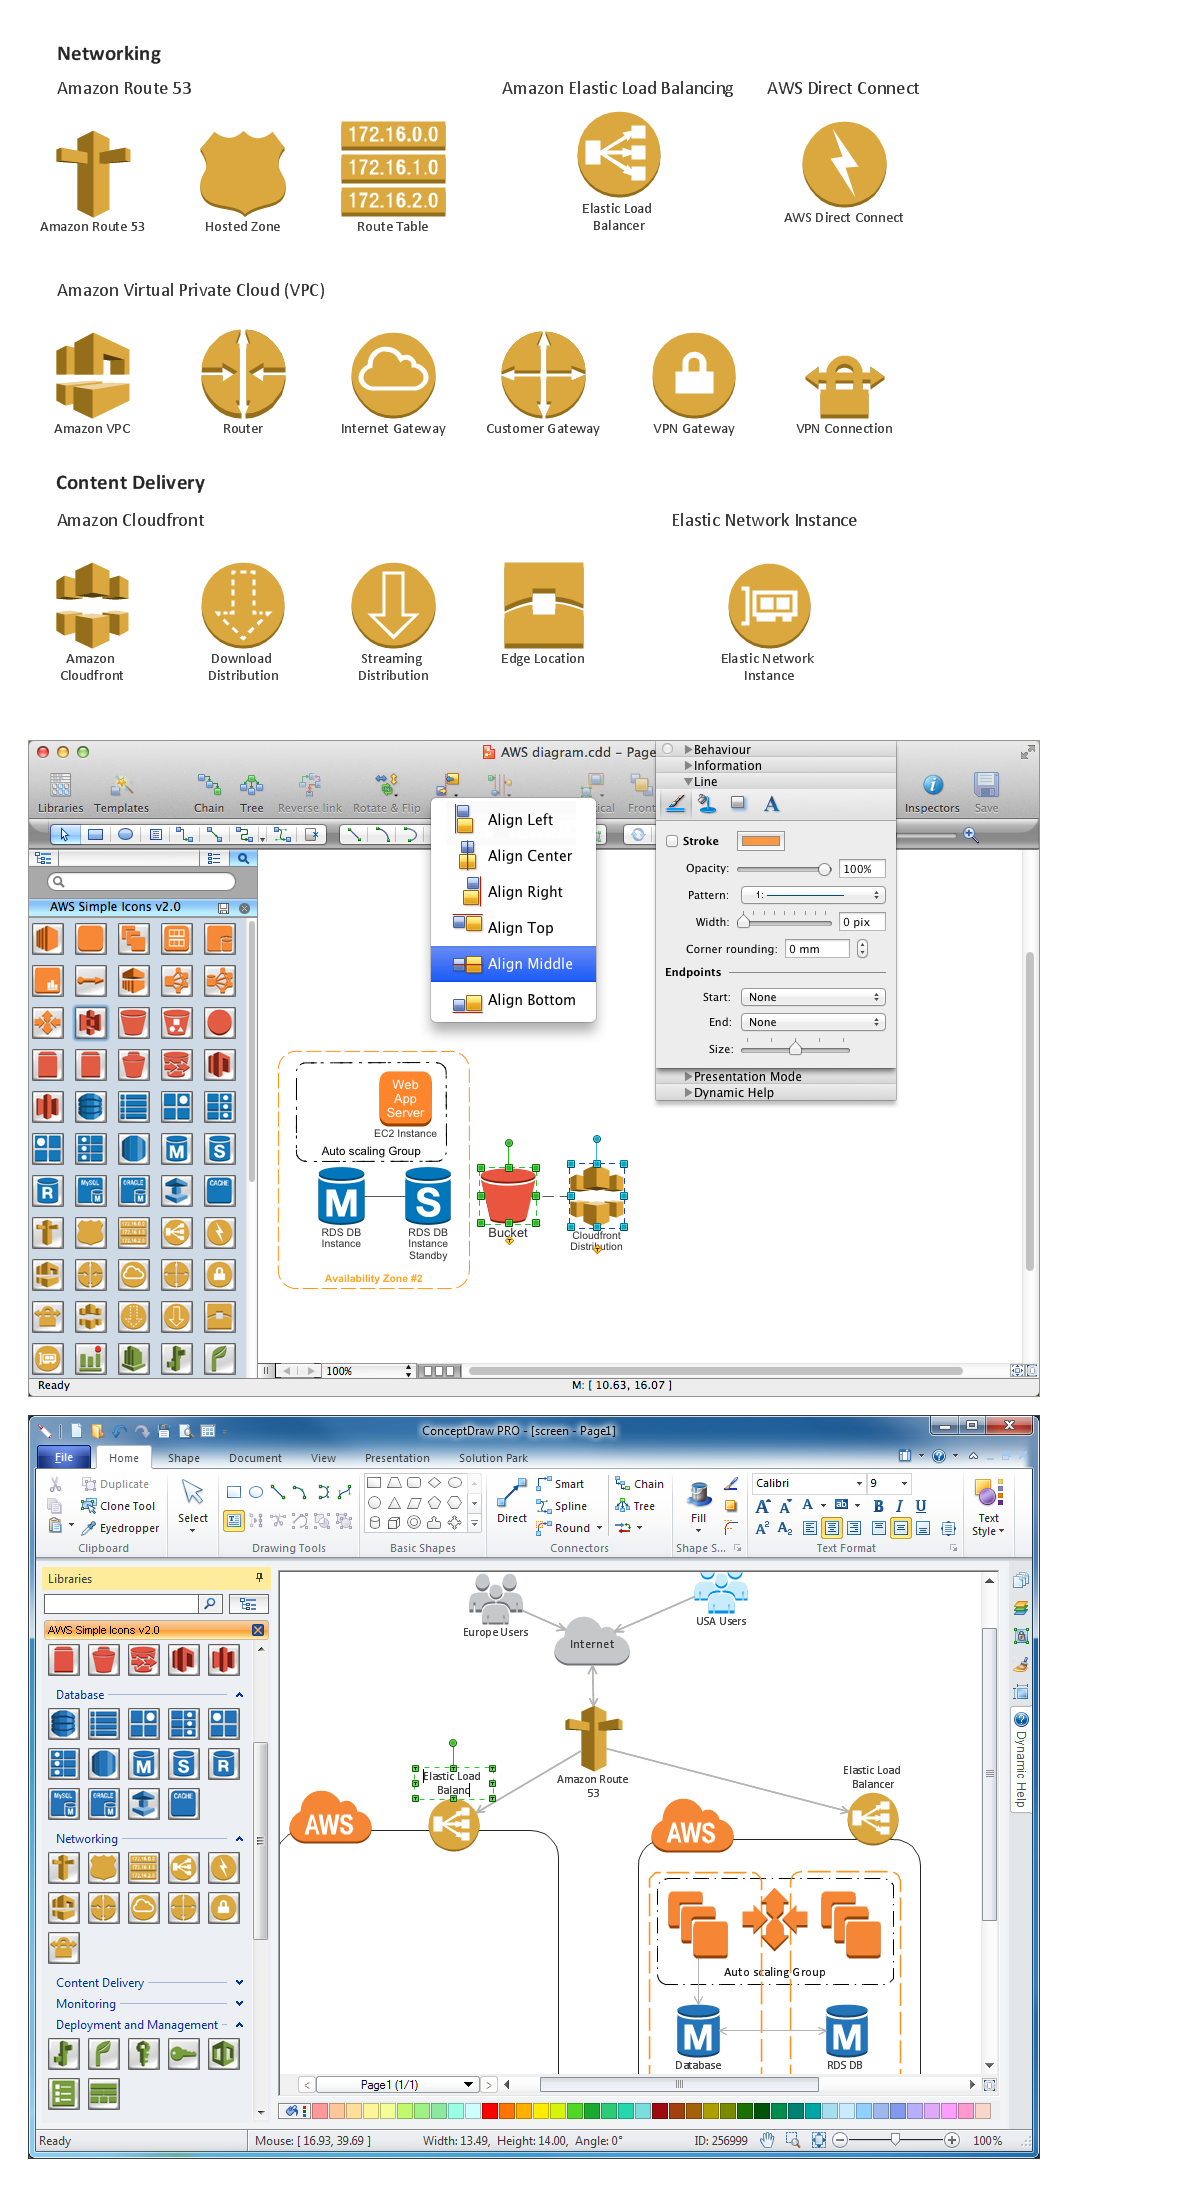
Picture: Diagramming software for Amazon Web Service icon set: Networking and Content Delivery
Appplication Services icons - Amazon AWS pro diagrams - AWS diagrams are part of architecturing tools provided with ConceptDraw Solution Park.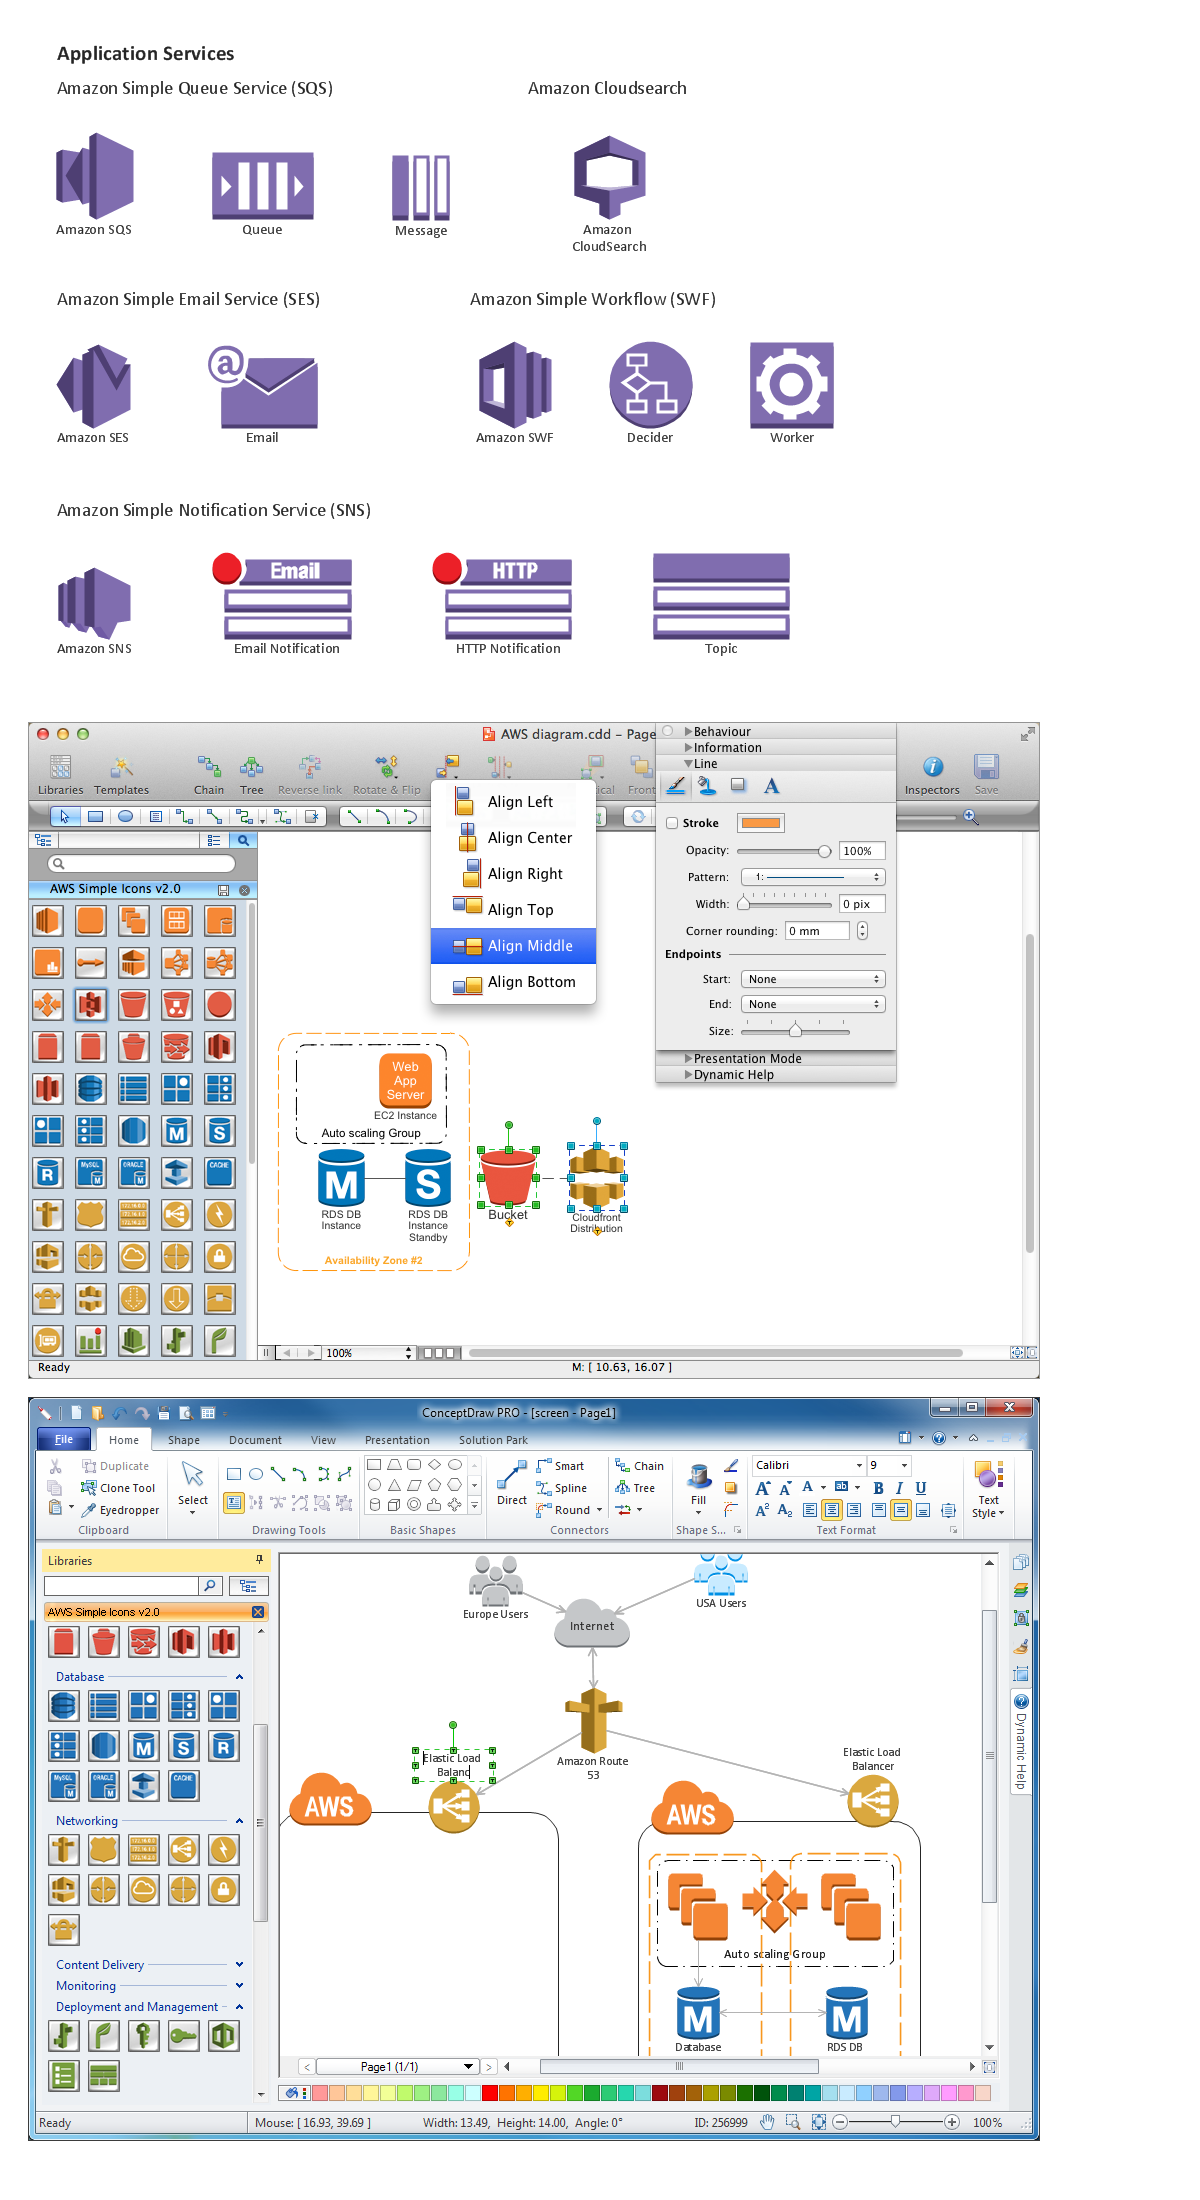
Picture: Diagramming software for Amazon Web Service icon set: Application Services
The ConceptDraw vector stencils library Cisco Multimedia, Voice, Phone contains equipment symbols for drawing the computer network diagrams.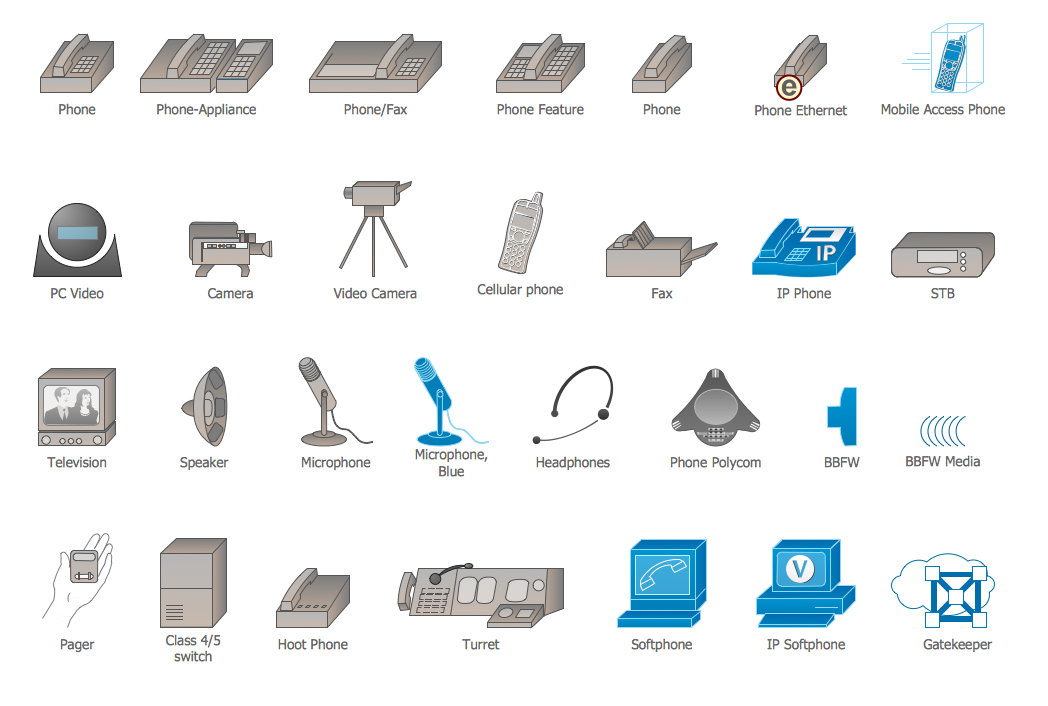
Picture: Cisco Multimedia, Voice, Phone. Cisco icons, shapes, stencils and symbols
Related Solution:
The innovative ConceptDraw DIAGRAM is a powerful drawing tool that changes the way diagrams are produced. While making diagrams has never been easier. This is more than enough versatility to draw any type of diagram with any degree of complexity.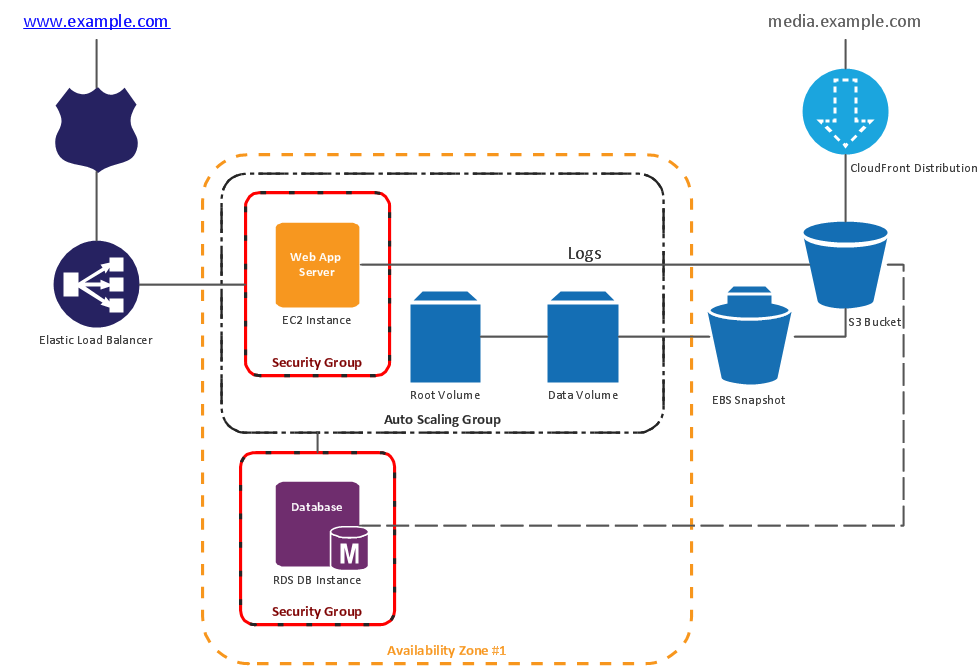
Picture: Making Diagrams Has Never Been Easier
Choose which of business design elements you love best.
Design your own style with Business and Finance Solutions from ConceptDraw DIAGRAM.
We created a full set of elements, business samples, templates and libraries with vector clip art for drawing the Business Illustrations.
Mark your report or presentation, pay an attention of audience on your drawings with vector business design elements.
Picture: Business - Design Elements
Related Solution:
Creating a detailed network plan can cause a lot of headache to an unexperienced user. And it is worth mentioning that ConceptDraw DIAGRAM is a decent tool for creating a network diagram, a tool that is easy-to-use. To get an accurate diagram use the vector shapes from the special libraries that represent workstations, network appliances, wiring systems and connect them with smart-connectors, just as simple as that.
This communication network diagram displays the way different components of a computer network communicate with each other. When representing network information, such as depicting all the equipment in a large network, it is helpful to make visual representation. Network diagram provides an easy way to show the way the connections between an equipment in a large network. This diagram of a communication network depicts a network composed of three sub-networks. It uses a network equipment symbols to represent the different devices that make up a network communication including routers, Ethernet devices and end-point equipment.
Picture: ConceptDraw DIAGRAM Network Diagram Tool
Related Solution:
Tool to draw Metro Map styled inforgraphics. Los Angeles Metro Rail and Liner sample.
This is a one-click tool to add stations to the map. It lets you control the direction in which you create new stations, change lengths, and add text labels and icons. It contains Lines, Stations, and Landmarks objects.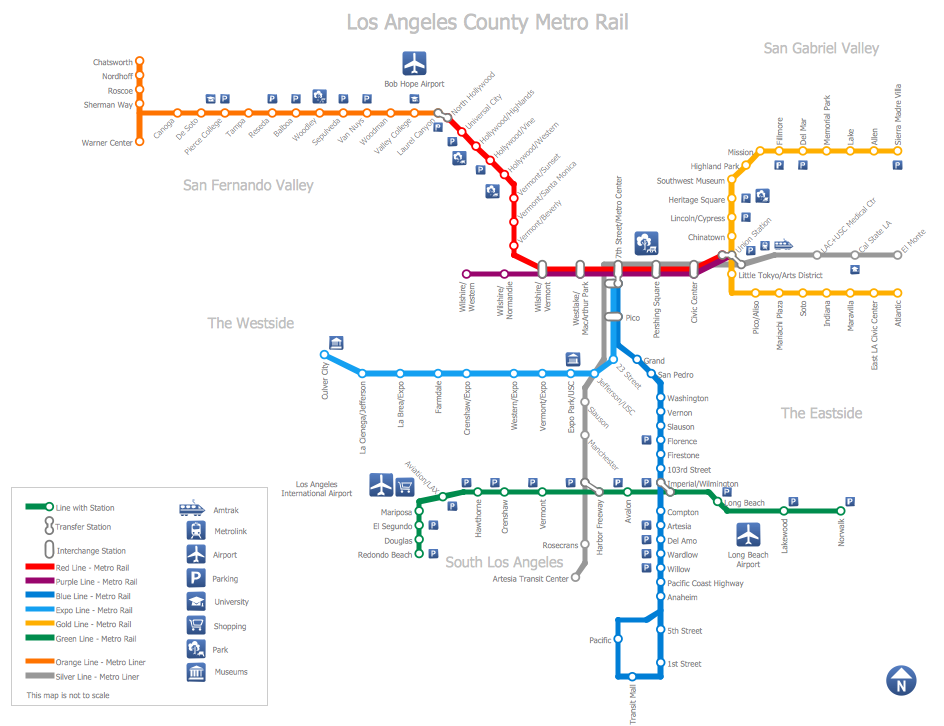
Picture: How to draw Metro Map style infographics? (Los Angeles)
Related Solution:
Computer networks nowadays are spread all across the world. The large number of parameters, such as geographic scale or communication protocols, can divide networks. One of the most common types of networks is called local area network (LAN). It convenient to represent network examples by means of diagrams.
This local area network (LAN) diagram provides an easy way to see the way the devices in a local network are interacted. The diagram uses a library containing specific symbols to represent network equipment , media and the end-user devices such as computers (PC, mac, laptop) , network printer, hubs, server and finally a modem. There are two types of network topologies: physical and logical. The current diagram represents precisely a physical type of LAN topology because it refers to the physical layout of a local network equipment.
Picture:
What is a Local Area Network?
Examples of LAN Diagrams
Related Solution: