How To Show Project Progress Peport on Web
Project Progress Report
Remote Presentation for Skype solution for ConceptDraw MINDMAP software allows a project manager to update current project progress and present reports visually for team and stakeholders. Progress reports include:
- project objectives
- project status
- tasks progress
- problems and possible solutions
- next period schedule
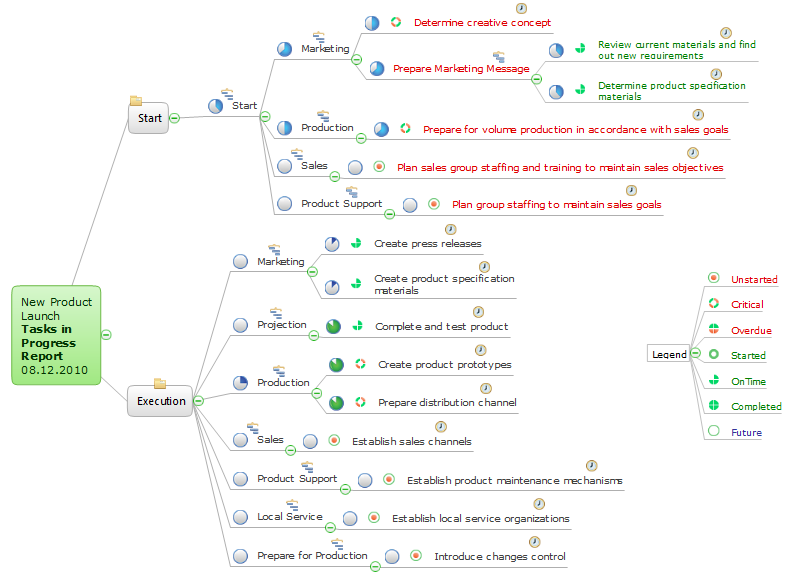
Sample 1. Project Tasks in Progress
"Project tasks in progress" mind map sample is created using ConceptDraw MINDMAP mind mapping software. This mind map example helps to learn how to use mindmap presentation via Skype to show the project tasks in progress report on Web.
Use this mindmap example for implementation of Remote Presentation for Skype solution from ConceptDraw Solution Park.
See also Samples:
TEN RELATED HOW TO's:
ConceptDraw PROJECT contains an extensive tool set to help project managers. The rich data visualization capability that is provided by ConceptDraw products helps you create project dashboards, one-click reports, multi-project views, Gantt charts, and resource views. Let′s learn how to get maximum value using ConceptDraw PROJECT!
Picture: How To Create Project Report
Workflow Diagram - workflow process diagram is a visual representation of a organizational process flow. Often it used as the same visual notation as process flow diagram. Visualising business processes using workflow diagram (workflow process diagram) allows estimate business process efficiency, analyse and optimize the process itself. Workflow diagram helps get focusing on each step and relations between workflow steps. ConceptDraw DIAGRAM is software for making workflow diagram. It contains specific designed graphics to draw workflow diagrams effectively. This is workflow diagram maker which do your work process effective.
Picture: Work Flow Process Chart
Related Solution:
The Cloud Computing is the use of the software and hardware that includes the great number of computers connected over the communication network such as the Internet. The Cloud name comes from the usage the cloud symbol on the system diagrams as the abstraction for the complex network infrastructure. This term is used as a marketing metaphor for the Internet.
This example was created in ConceptDraw DIAGRAM using the Computer and Networks Area of ConceptDraw Solution Park and shows the Cloud Computing.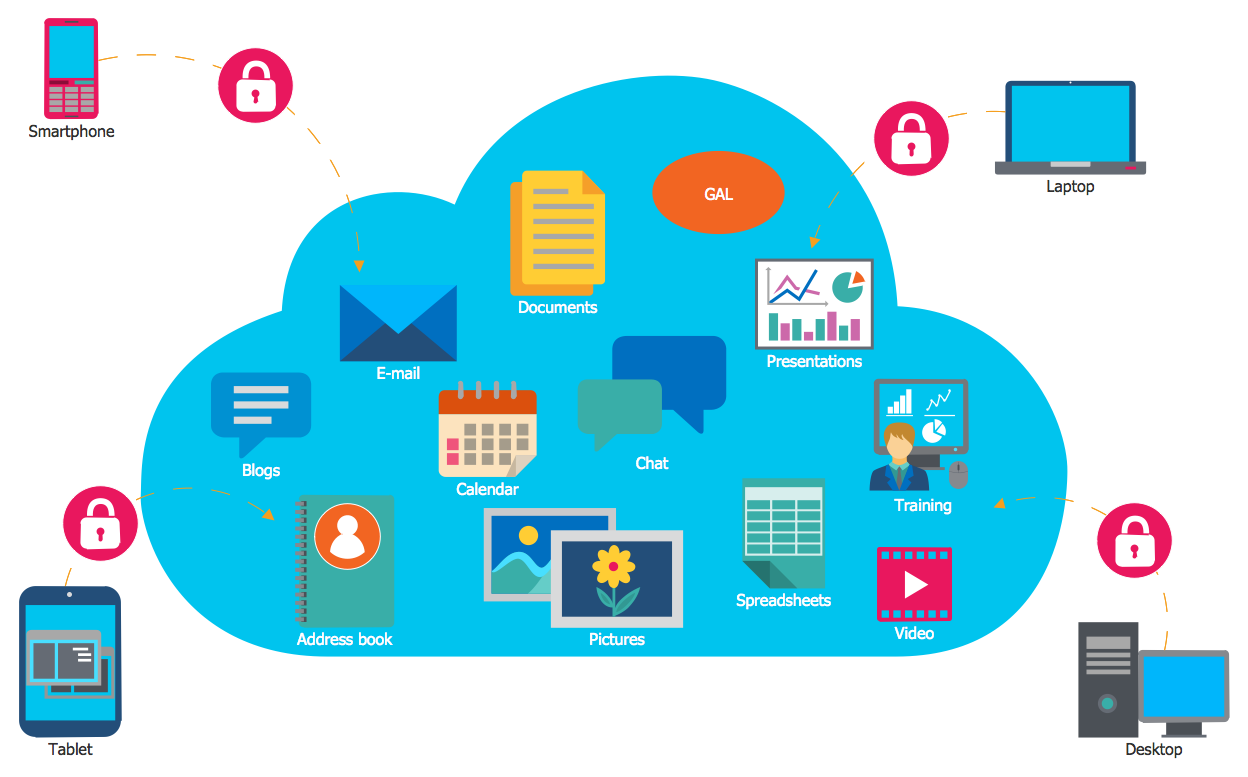
Picture: Cloud Computing
Related Solution:
UML Activity Diagram illustrate the business and operational step-by-step workflow of components in a system and shows the overall flow of control.
Picture: UML Activity Diagram. Design Elements
ConceptDraw DIAGRAM is a powerful business and technical diagramming software tool that enables you to design professional-looking graphics, diagrams, flowcharts, floor plans and much more in just minutes. Maintain business processes performance with clear visual documentation. Effectively present and communicate information in a clear and concise manner with ConceptDraw DIAGRAM.
Picture: ConceptDraw DIAGRAM
ConceptDraw gives the ability to draw Flowchart documents. Flowcharts solutionis a powerful tool that extends ConceptDraw application for drawing business flowcharts.
ConceptDraw DIAGRAM vector diagramming and business graphics software enhanced with with templates, green and interactive flowchart makers, samples and stencil libraries from ConceptDraw Solution Park which all focused to help with drawing flowcharts, block diagrams, bar charts, histograms, pie charts, divided bar diagrams, line graphs, area charts, scatter plots, circular arrows diagrams, Venn diagrams, bubble diagrams, concept maps, and others.
Picture: The Best Flowchart Software Available
Related Solution:
ConceptDraw DIAGRAM is a flowchart creating software. This software includes over 20 vector stencils in libraries. These objects allow you to create well-designed flowcharts.
Put an initial object from library to a page and use RapidDraw technology clicking on direction arrows to add new objects to the flowchart. This way you can make flowchart quickly.
Picture: How To Create a Flow Chart in ConceptDraw
Related Solution:
ConceptDraw the easy flowchart software that gives users the ability to draw any type of flowcharts. Fast visualization of the structured data with the vector stencils from object libraries by using RapidDraw technology.
Picture: Easy Flowchart Software
Related Solution:
ConceptDraw PROJECT is an effective tool for new and experienced users with a fine balance of usability and powerful functionality.
Picture: ConceptDraw PROJECT Software Overview
Every good manager has to predict different situations that might occur in any process. If only every of them Swot Analysis Examples at that time, I could have succeeded in my career. Unfortunately I didn't have any notion about it.
This is a sample of SWOT diagram. This is also a mean of marketing strategy elaboration. Before as filling this table, marketing manager has to investigate both external and internal factors. The effective SWOT analysis helps to gain benefits from opportunities and decrease threats by conversion of strengths and weaknesses into advantage. The SWOT and TOWS Analysis solution to ConceptDraw offers a number of template matrices for SWOT, designed to support a marketing strategy development process.
Picture: Swot Analysis Examples
ConceptDraw
MINDMAP 16