Made with
ConceptDraw
MINDMAP 16

Critical Tasks

Project Management

In PM solutions we support many project methodologies such as Agile and Simple Projects. Methodology solutions help in implementing best practices in project management. CS Odessa provides Toolbox solutions to support solving issues related to planning, tracking, milestones, events, resource usage, and other typical project management functions. Toolbox Solutions help you deal with common project situations in an extraordinary way.

PM Planning

Benefits

PM Planning automatically creates documents that reflect a project’s status for people who have different project roles. Individuals are able to use the reporting capability built into ConceptDraw Solution Park for their benefit. The report capability addresses more than management requirements and is a great tool to guide individual task completions. This solution in ConceptDraw Solution Park improves planning for all team members and is a strong management and productivity tool.

Objective

Extend your planning and reporting capability, prepare a wide range of project reports, and improve project communications.

Solution Purpose

Create project reports that address the needs of project managers and senior management and keep everyone informed on daily progress and monthly objectives. These collective reports help accurately plan, maintain, and finish projects on time. Also available are short Microreports that can you can email to project members to keep everyone updated on project statuses, tasks, and resources.

Intended For

Project managers.

Products and Methods

Report Basket is a tool for the effective planning of different project stages. The Report Basket makes the process of reporting simple and is a good tool for planning, communicating, making decisions, and doing analytical work.

Critical Tasks

Generates a mind map that contains topics of Task Type with Tasks that are behind schedule.

Critical Tasks *

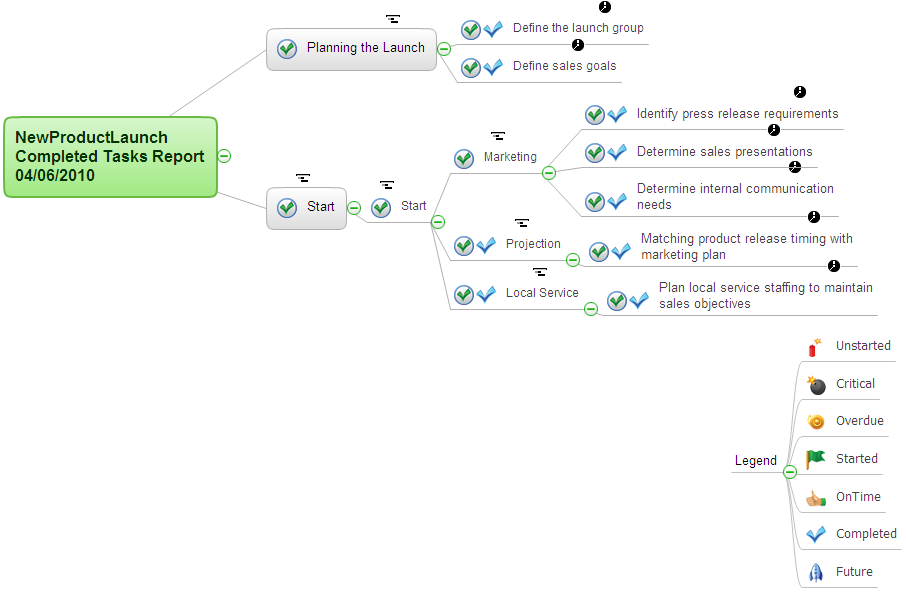
Example 1. Critical Tasks


The Benefits for ConceptDraw MINDMAP Brainstorming Software

  • ConceptDraw MINDMAP is effective for brainstorming, designing mind maps, idea generating, creative and lateral thinking, creativity and problem solving.
  • ConceptDraw MINDMAP is ideal for team and personal work in Business, Marketing and Project Management.
  • The libraries with large quantity of vector objects help to illustrate your mind maps and to make them bright, visual and comprehensible.
  • Use of View Navigator tool lets create presentations from a mind map: you can simply select the map parts you want to present, sequence your slides, and preview the presentation.
  • ConceptDraw MINDMAP provides wide capabilities of importing and exporting in various formats: Microsoft PowerPoint, Microsoft Word, MS Excel, Mindjet MindManager, image, HTML, PDF file.


FOUR RELATED HOW TO's:
It is so simple making the drawing process easier and faster. you just need to choose the right drawing software. ConceptDraw Arrows10 Technology - This is so easy and fast to draw any type of diagram with any degree of complexity.Simple & Fast Diagram Software *
Picture: Simple & Fast Diagram Software
Related Solutions:
The Circular Arrows Diagrams are very popular in management and marketing. They are the useful way to visualize a sequence of steps, tasks, or events as a circular flow. But how design the Circular Arrows Diagram quick and easy? You will need a powerful software. ConceptDraw DIAGRAM charting and vector drawing software is exactly what you need. Extended with a multi-functional Business Diagrams solution from the Management Area, ConceptDraw DIAGRAM is the best for drawing the Circular Arrows Diagrams.Circular Arrows Diagram - Advanced Persistent Threat Lifecycle
Picture: Circular Arrows
Related Solution:
ConceptDraw PROJECT’s powerful reporting engine lets you generate a set of tabular reports with just one click, or visualize your project as Radial Tasks Structures, Work Breakdown Structures and Resource Calendars. It also provides you with dynamic Project Dashboards.How to Report Task
Picture: How to Report Task's Execution with Gantt Chart
While creating flowcharts and process flow diagrams, you should use special objects to define different statements, so anyone aware of flowcharts can get your scheme right. There is a short and an extended list of basic flowchart symbols and their meaning. Basic flowchart symbols include terminator objects, rectangles for describing steps of a process, diamonds representing appearing conditions and questions and parallelograms to show incoming data. This diagram gives a general review of the standard symbols that are used when creating flowcharts and process flow diagrams. The practice of using a set of standard flowchart symbols was admitted in order to make flowcharts and other process flow diagrams created by any person properly understandable by other people. The flowchart symbols depict different kinds of actions and phases in a process. The sequence of the actions, and the relationships between them are shown by special lines and arrows. There are a large number of flowchart symbols. Which of them can be used in the particular diagram depends on its type. For instance, some symbols used in data flow diagrams usually are not used in the process flowcharts. Business process system use exactly these flowchart symbols.Flowchart example showing a customer request approval process with start, input output, process steps, decision branches, and end
Picture: Flowchart Symbols: Meaning and Examples
Related Solution:
ConceptDraw
MINDMAP 16