Made with
ConceptDraw
DIAGRAM 18

Market Economy

A market economy is a market-oriented type of economic system. It supposes the existence of markets playing a dominant role in the allocation of capital and the factors of production. A market economy is characterized by: private ownership, self-interest, freedom of choice, competition, and system of markets and prices. Most goods and services are owned by individuals and private businesses, not by the government. The individuals have a permit to profit from private ownership of business and property, and can work for themselves. Their self-interest is one of the key factors for success of their businesses and market economy as a whole.

In conditions of a market economy, all major decisions are guided by supply and demand, by interactions of individual citizens, consumers, and businesses. The supply and demand direct the investment, production, pricing, and distribution of goods and services. The businesses in the market economy have wide freedom. They are free to produce, sell, and purchase goods as they want, according to government regulations. The government performs only a regulatory function, ensures the opening of markets and their stable, fair, and safe working. It controls the quality of products and their safety for consumption. The government's intervention or central planning can have a place, but absolutely insignificant.

Businesses have freedom of choice, free enterprise, are free to get and use resources to produce goods and services, and sell them in markets of their choice. Employees are free to seek any jobs, consumers are free to buy the goods and services they want. A market economy is a self-regulating and self-adjusting economy. Most economic decisions are made by consumers and sellers. A market brings consumers and sellers together. The businesses set the prices at their discretion. The competition is present among producers, the prices are influenced by it and kept low. The prices are decreased with the goal of attracting more consumers. As soon as demand increases, the prices in turn rise due to the law of demand. According to the changing desires and abilities of the market players, the production of goods is regulated.

The competition is also applied to employees and consumers. The employees compete for the highest-paying jobs, and consumers for the best products at the lowest prices. The competition breeds efficiency and ensures producing of the most desired goods and services. It gives consumers a choice and offers goods and services for the lowest prices they can find. The competition ensures the increased efficiency in the production and supply of goods and services, allows keeping prices fair. However market economy marginalizes businesses unable to compete, this contributes to inequality income.

Plus, a market economy encourages entrepreneurship, new ventures, innovations, market development and all this is rewarded with profits. It gives wide opportunities for attracting foreign investors and markets growth. In its turn, the market is motivated to sell offerings to the highest price.

Economic System

Example 1. Economic System

Most developed countries have mixed economies and combine free markets with some government interference. However, it is considered they have market economies because the majority of their activities acts according to the market laws. There are also discussions regarding the amount of government intervention for ensuring optimal economic efficiency. The United States is the premier market economy in the world. It has more characteristics of a market economy than a command economy. The U.S. Constitution protects the ownership of private property, free enterprise, freedom of choice, and innovations as properties by establishing a copyright clause. It prohibits states from taxing each other’s goods and services, limits government powers by protecting people from unreasonable searches and confiscations.

Use ConceptDraw DIAGRAM with Economy Infographics solution to design accurate, unique, and professional-looking infographics and diagrams related to the market economy, its features and specifics in different countries, determinants of size of market, and more. You have the possibility to experiment with colors and designs to create the best economy infographics.

Economy Infographics Solution - Libraries Design Objects

Example 2. Economy Infographics Solution - Libraries Design Objects

Economy Infographics solution offers 6 libraries with a large variety of pre-made vector design elements, icons, clipart, and symbols applied in economics:

  • Digital Economy
  • Economy
  • Heavy Industry
  • Light Industry
  • Raw Materials
  • Services

All objects are customizable, easily resizable without loss of quality and you have full freedom when designing your economy infographics.

Local Regional and Global Markets

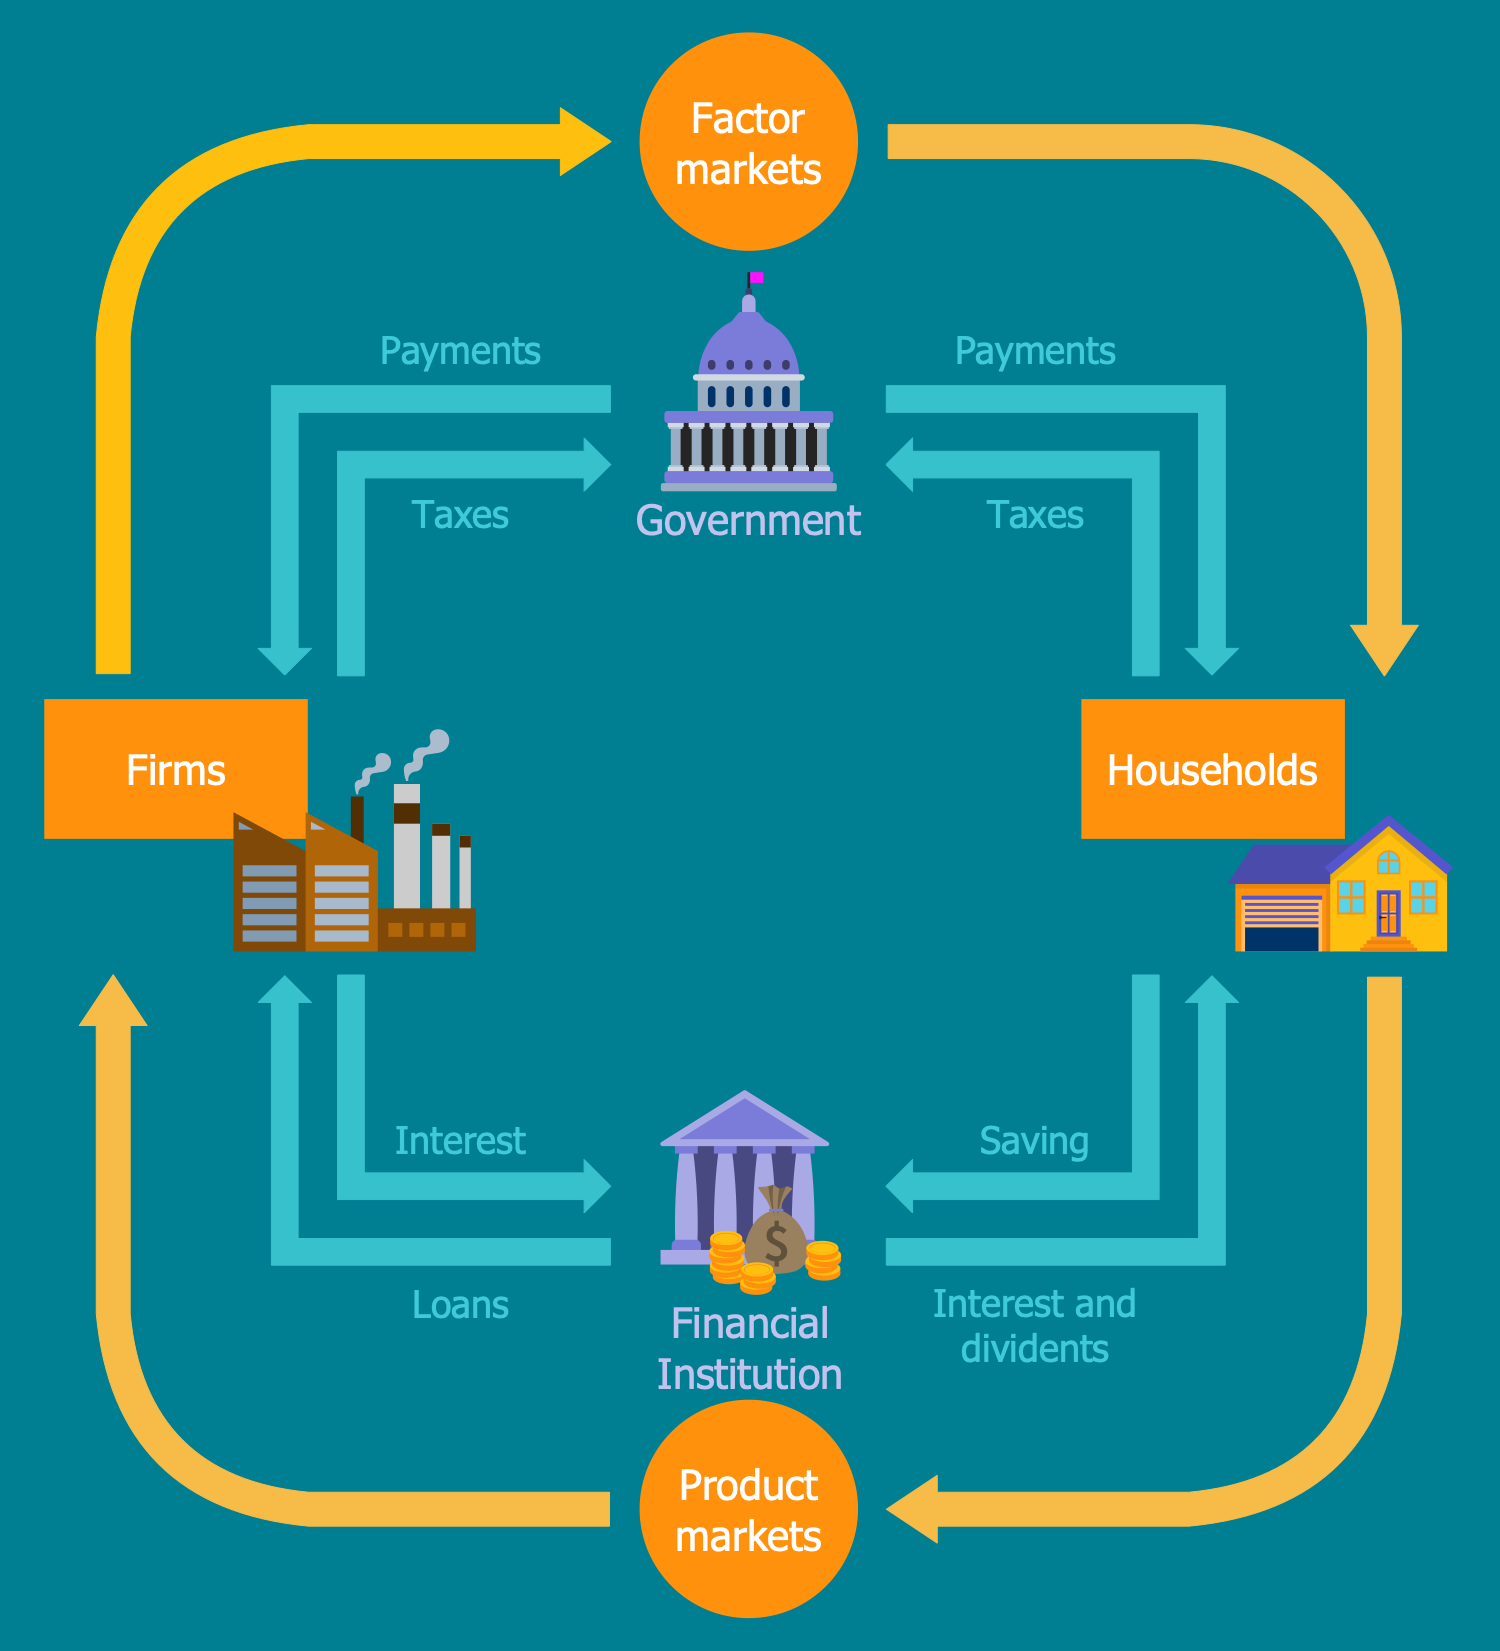
Example 3. Local Regional and Global Markets

The infographics you see on this page were created in ConceptDraw DIAGRAM software using the Economy Infographics Solution and its pre-made pictograms and clipart. They successfully demonstrate the solution's capabilities and professional results you can achieve. An experienced user spent 10-15 minutes creating each of these samples.

Use the powerful tools of the Economy Infographics Solution for ConceptDraw DIAGRAM software to create your own infographics and diagrams of any complexity fast and easy, and then successfully use them in your work and personal activity.

All source documents are vector graphic documents. They are available for reviewing, modifying, or converting to a variety of formats (PDF file, MS PowerPoint, MS Visio, and many more graphic formats) from the ConceptDraw STORE. The Economy Infographics Solution is available for all ConceptDraw DIAGRAM users.

TEN RELATED HOW TO's:
An example flowchart of marketing analysis shows main steps you have to challenge writing a marketing analysis.Flowchart Example: Flow Chart of Marketing Analysis *
Picture: Flowchart Example: Flow Chart of Marketing Analysis
Related Solution:
Any business process consists from a number of tasks carrying out the certain business goal. It is useful to diagram business processes to ensure that they are as foolproof, logical and sequential as possible. This business process diagram describes a typical booking process flow by the example of a cab booking process. It can be used as a roadmap for any booking system implementation. Diagramming a business process allows you to look at the entire project and take into account all types of possible scenarios. Business process diagram helps you investigate and clarify the process thoroughly so that you can find out how it can be improved. Business process diagram supports team communications by ensuring that each process element is clear and everyone in the team is on the same page. Sometimes your company brings you less profit than you expect it to be, and it’s difficult to reveal the causes. Maybe it’s time to learn new technologies, because business diagram are easily developed by means of special software, so you won’t make any extra effort. In return, you will increase your productivity and get more done in a less time.Business Diagram Software *
Picture: Business Diagram Software
Related Solutions:
Describing the way data flows through an information system might become a subject of a study. One of the kinds on a data flow diagram is called Gane Sarson Diagram after its authors, and it slightly differs from other notations. Process symbols in this notation are depicted as rounded rectangles connected with arrows representing data flows. This is a sample of data flow diagram. It demonstrates utilization of the Gane-Sarson notation for making DFD on the example of an online appointment system of the Health Centre. This sample is used the vector objects library of Gane-Sarson DFD notation supplied by the ConceptDraw solution for data flow diagramming. It contains all symbols of the Gane-Sarson notation including connectors, jumps, and processes. This solution can be successfully utilized to generate DFDs for business documentation, and presentations.Gane Sarson Diagram
Picture: Gane Sarson Diagram
Describing a workflow or approval process can take hours and be too complicated, especially since there are options to do it quickly and vividly. Diagrams called flowcharts replace long paragraphs of boring text and represent information in a graphic way. You can draw one on paper or you can use flowchart software to do it quickly and scalable. This kind of software is easy to use and you don’t need any special skills to start using it. In addition, there are a lot examples and predesigned templates on the Internet. Flowcharts are a best tool for staking out a huge and complex process into some small readable parts. Surely, flowcharts can be drawn manually but the use of standard symbols that make it clear for a wide audience makes a software tool preferred for this task. The core for a successful flowchart is its simplicity. That is why often before beginning making flowchart through software, people draw the sketch on a piece of paper. Designing an effective flowchart means the combination of the data needed to be shown and the simplicity with which you depict it.Flowchart Software
Picture: Flowchart Software: A Comprehensive Guide
Related Solution:
Use Case Diagrams technology. An effective management of changes is significantly facilitated by way of definition and documenting of business-requirements.IDEF9 Standard *
Picture: IDEF9 Standard
How to draw pictorial chart quick, easy and effective? ConceptDraw DIAGRAM offers the unique Pictorial Infographics Solution that will help you! Pictorial Infographics solution contains large number of libraries with variety of predesigned vector pictograms that allows you design infographics in minutes. There are available 10 libraries with 197 vector pictograms.How to Draw Pictorial Chart. <br> How to Use Infograms *
Picture: How to Draw Pictorial Chart. How to Use Infograms
Related Solution:
Use Case Diagrams technology. IDEF1x standard - for work with relational data bases. IDEF1x standard is meant for constructing of conceptual schemes which represent the structure of data in the context of the concerned system, for example, a commercial organization.IDEF1X Standard *
Picture: IDEF1X Standard
Visio Files and ConceptDraw. ConceptDraw DIAGRAM is compatible with MS Visio.VDX formatted files.VDX is Visio’s open XML file format, and it can be easily imported and exported by ConceptDraw DIAGRAM.Visio Files and ConceptDraw *
Picture: Visio Files and ConceptDraw
If neither of 45 vector shapes of the Cross-Functional Flowcharts solution don't fit your needs, you will want to learn How to create a unique Cross-Functional flowchart. ConceptDraw Arrows10 Technology - This is more than enough versatility to draw any type of diagram with any degree of complexity. Drawing software lets you to make horizontal and vertical, audit, opportunity and many more flowcharts.How to Create a Cross Functional Flow Chart *
Picture: How to Create a Cross Functional Flow Chart
Account Flowchart Stockbridge SystemOnce you decide to create a flowchart mentioning all the processes , you can always use well as professionally software — ConceptDrawAccount Flowchart Stockbridge System. Flowchart Examples
Picture:
Account Flowchart Stockbridge System
Flowchart Examples
Related Solution:
ConceptDraw
DIAGRAM 18