Data Flow Chart Template
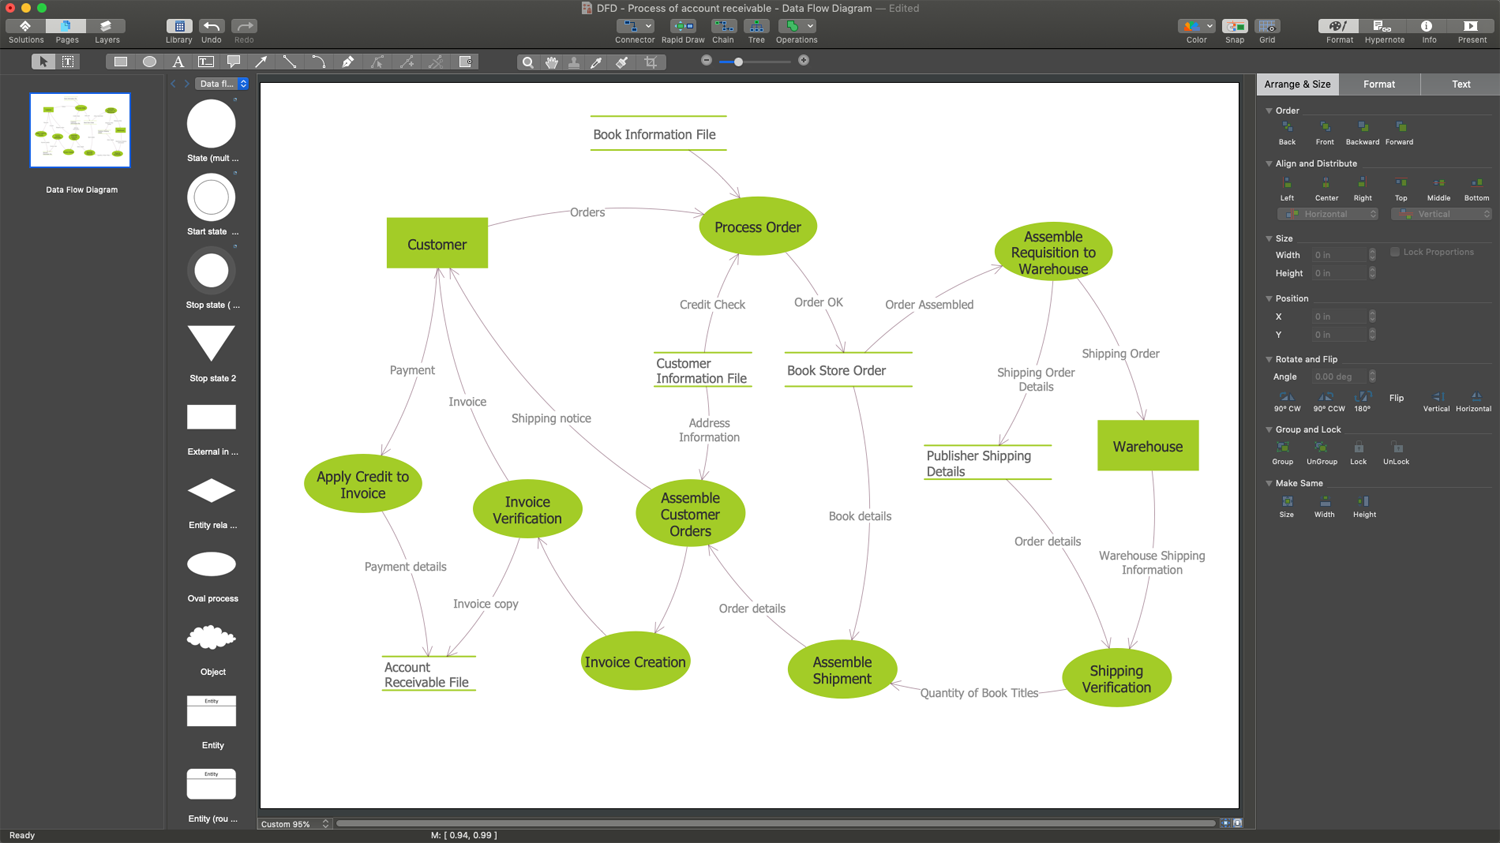
Designing a Data Flow Diagram is incredibly simple in the ConceptDraw DIAGRAM. You can start with a blank sheet or choose one of the offered DFD templates included in the Data Flow Diagrams solution. Find them in ConceptDraw STORE in the corresponding category. Once started with a predesigned Data Flow Chart template, use also the ready-made vector objects from the Data Flow Diagrams solution libraries. Use the start state shape to mark the start point in a Data Flow Diagram and the stop state shape to mark the end of the process. Add the entities, process, and data store objects, and align your shapes to be easily perceived in a diagram. Type the text, adjust the shapes and arrows according to the desired style and color design.
Example 1. Data Flow Chart Template
Data Flow Diagrams solution includes three customizable templates:
- Data Flow Diagram template
- Data Flow Model Diagram template
- Yourdon and Coad template
You can choose any desired from these quick-start templates to start your drawing DFD immediately and without efforts. Design with ease Data Flow Diagram model, break down the processes into detailed subprocesses in minutes.

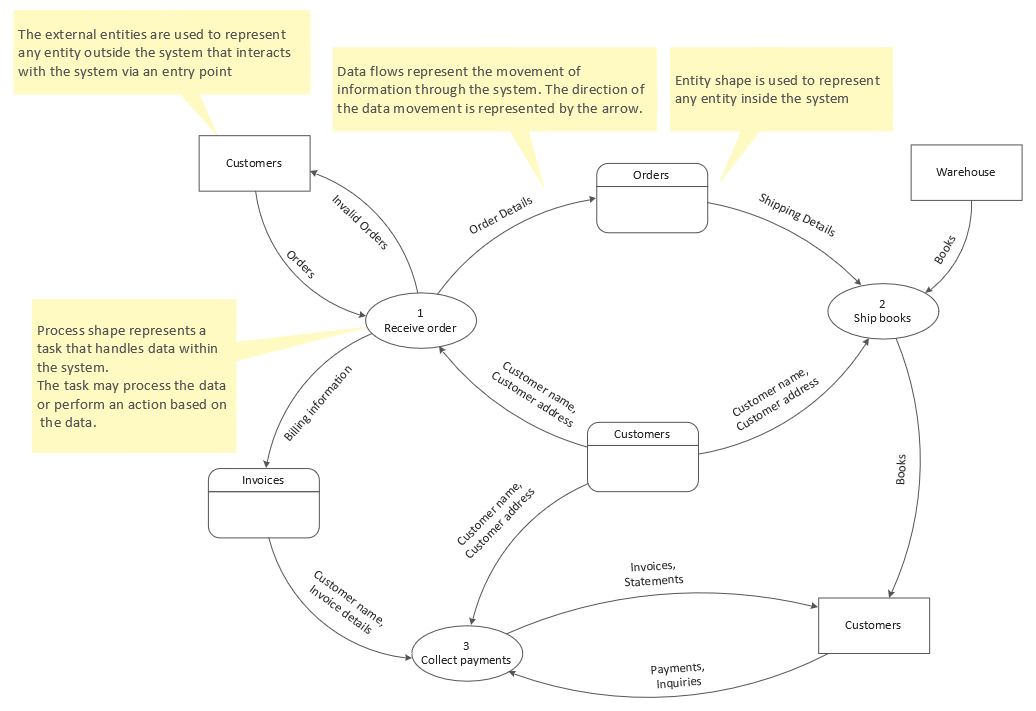
Example 2. Yourdon and Coad Template
These professionally designed templates describe the DFD elements and show different types of DFD constructed using different notations. You can successfully use these templates to start drawing your own Data Flow Diagrams and further use everywhere — in business documents, presentations, on websites.
Use Data Flow Diagrams solution for designing your own Data Flow Diagrams quick, simply and effectively.
All source documents are vector graphic documents. They are available for reviewing, modifying, or converting to a variety of formats (PDF file, MS PowerPoint, MS Visio, and many graphic formats) from the ConceptDraw STORE. The Data Flow Diagrams Solution is available for all ConceptDraw DIAGRAM users.
See also samples:
- Software Diagrams
- Software Development — iPhone User Interface
- Software Development — Windows 8 User Interface
- Software Development — DFD
- Software Development — ERD
- Software Development — IDEF0
- Software Development — Rapid UML
- Software Development — ATM UML Diagrams
- Software Development — Website Wireframe
- Software Development — SYSML

This template shows the Context Diagram. It was created in ConceptDraw DIAGRAM diagramming and vector drawing software using the Block Diagrams Solution from the “Diagrams” area of ConceptDraw Solution Park. The context diagram graphically identifies the system. external factors, and relations between them. It’s a high level view of the system. The context diagrams are widely used in software engineering and systems engineering for designing the systems that process the information.