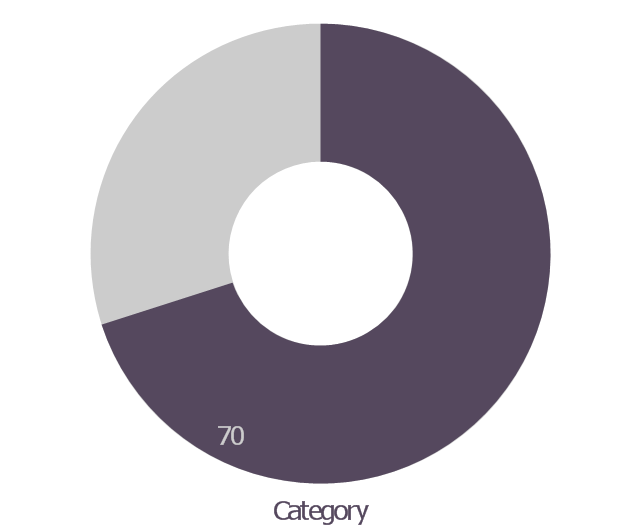
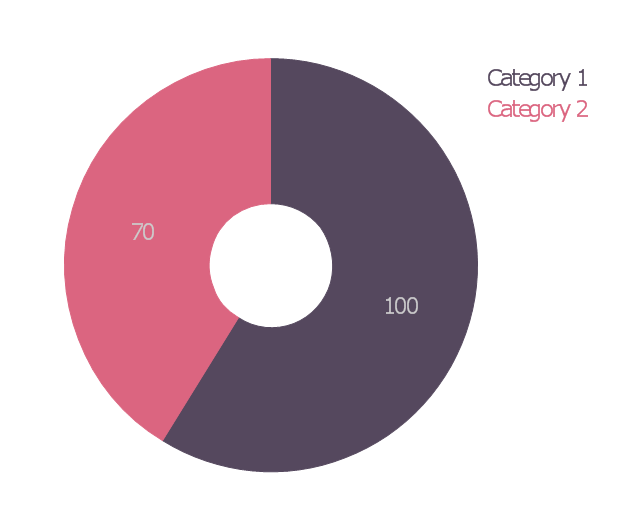
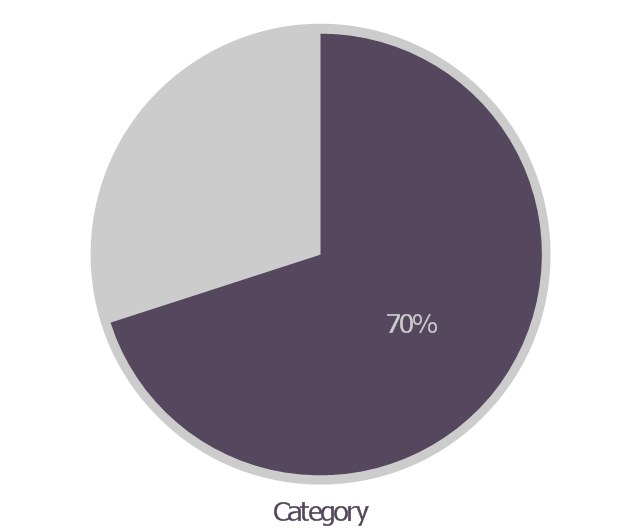
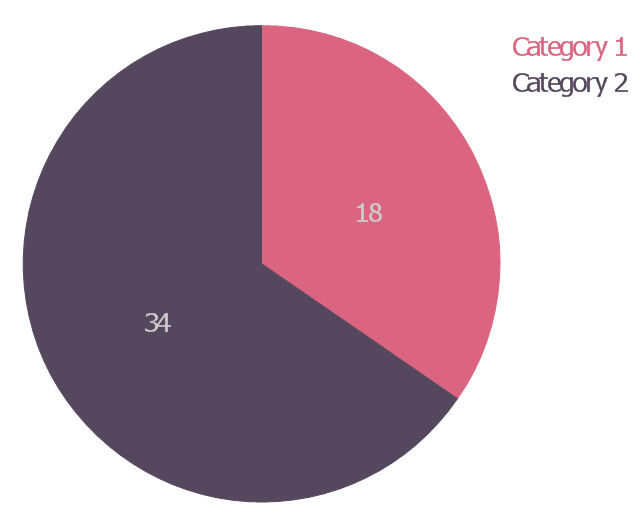
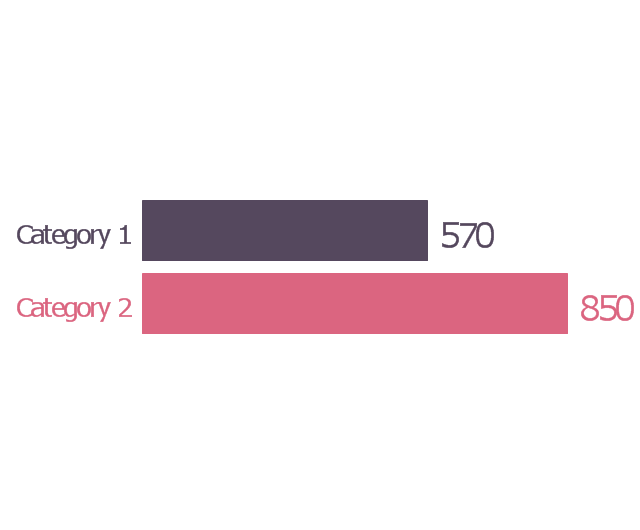
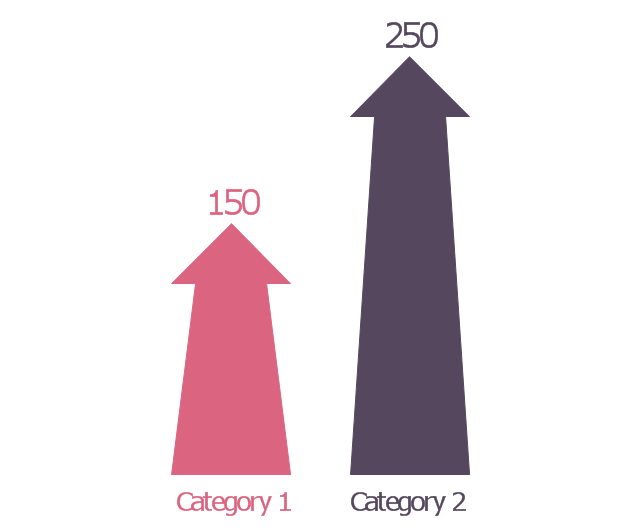
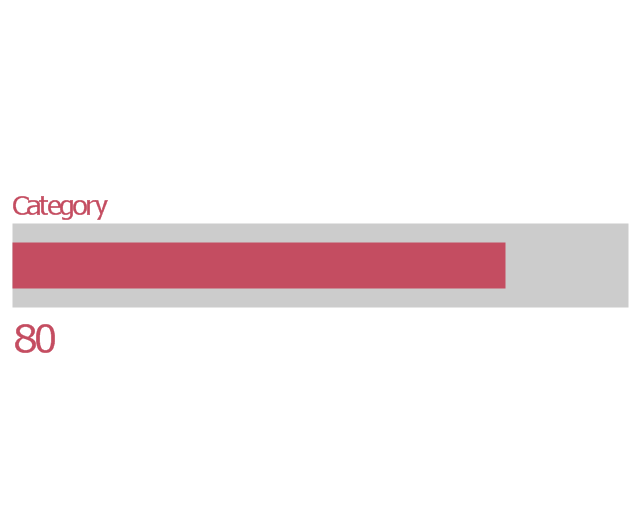
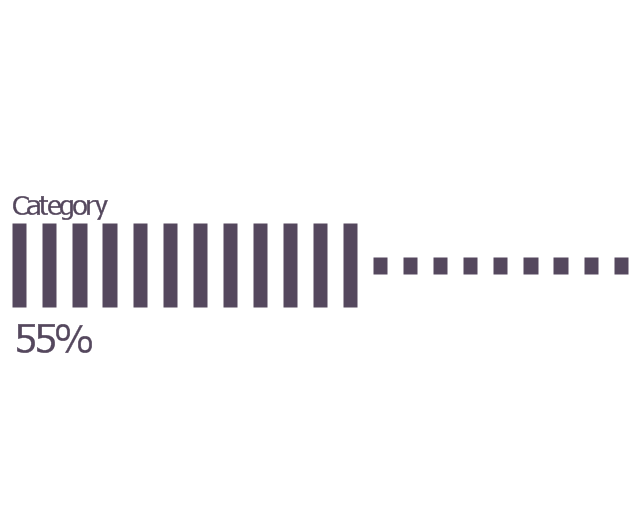
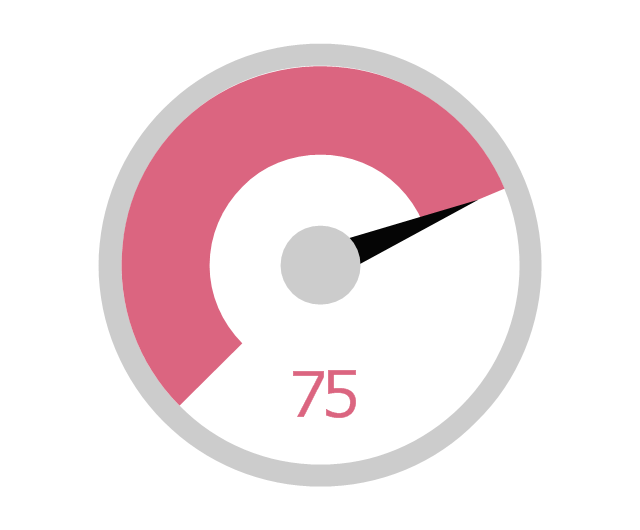
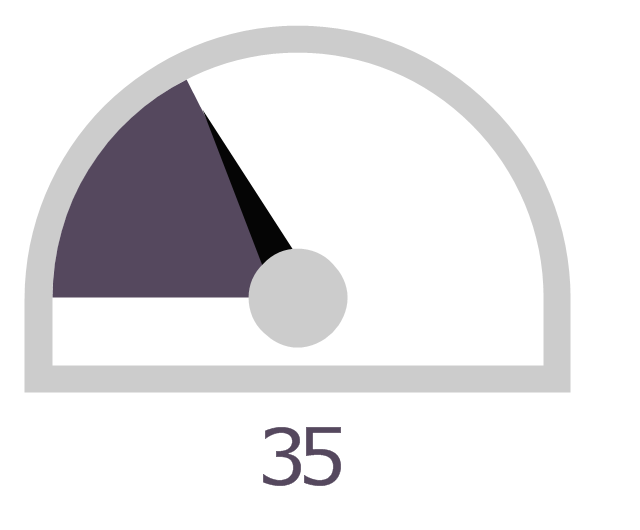
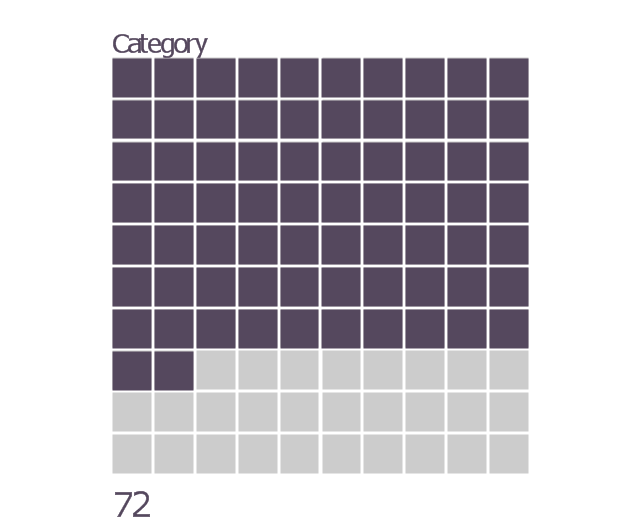
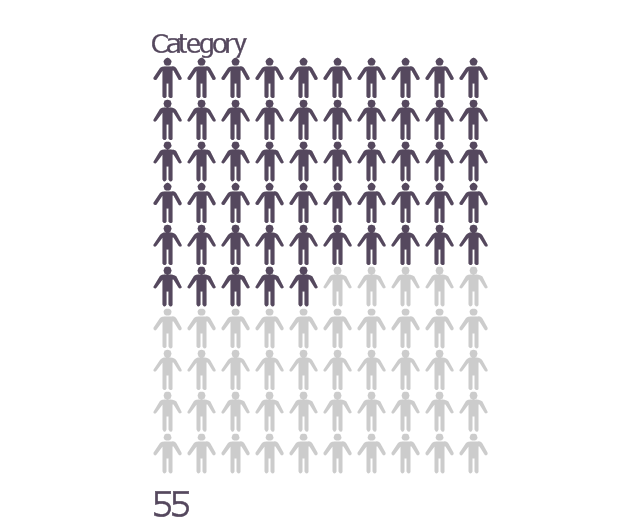
The vector stencils library "Education indicators" contains 12 graphic indicators.
Use these visual indicators to design your educational infogram.
The vector stencils library "Education indicators" is included in the Education Infographics solution from the Business Infographics area of ConceptDraw Solution Park.
Use these visual indicators to design your educational infogram.
The vector stencils library "Education indicators" is included in the Education Infographics solution from the Business Infographics area of ConceptDraw Solution Park.
Waterfall Bar Chart
Waterfall chart shows the changing of the value from one state to another through the series of intermediate changes. The waterfall diagrams are widely used in the business. They are used to represent the set of figures and allow link the individual values to the whole.
 Target and Circular Diagrams
This solution extends ConceptDraw PRO software with samples, templates and library of design elements for drawing the Target and Circular Diagrams.
- Arrows Donut Chart Shape
- Donut Chart
- Examples of Flowcharts, Org Charts and More | Pie Chart Examples ...
- Performance Indicators | Design elements - Composition charts and ...
- Pie Charts | Best Program to Make Diagrams | Basic Pie Charts ...
- Percentage Pie Chart . Pie Chart Examples | How to Draw the ...
- Pie charts - Vector stencils library | Circular arrows diagrams - Vector ...
- Pie charts - Vector stencils library | Data-driven charts - Vector ...
- Pie Chart Software | Circular arrows diagrams - Vector stencils ...
- Donut Chart To Bar
- Pie charts - Vector stencils library | How to Draw the Different Types ...
- Pie Donut Chart . Pie Chart Examples
- Chart Donut
- Sector diagram - Template | Pie Chart Examples and Templates ...
- Pie Chart Software | Donut Chart Templates | Chart Maker for ...
- Pie Chart Software | Donut Chart Templates | Chart Maker for ...
- Donut Graph Vector
- Pie Donut Chart . Pie Chart Examples
- Composition indicators - Vector stencils library | Design elements ...
- Gauge Chart
- ERD | Entity Relationship Diagrams, ERD Software for Mac and Win
- Flowchart | Basic Flowchart Symbols and Meaning
- Flowchart | Flowchart Design - Symbols, Shapes, Stencils and Icons
- Flowchart | Flow Chart Symbols
- Electrical | Electrical Drawing - Wiring and Circuits Schematics
- Flowchart | Common Flowchart Symbols
- Flowchart | Common Flowchart Symbols
