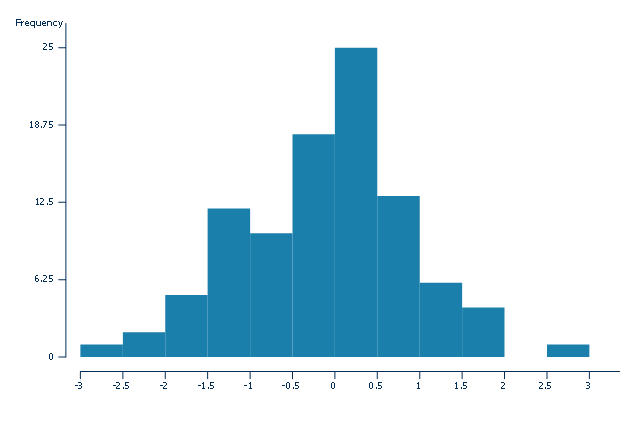
This histogram sample shows the random sample of 100 observations from the normal distribution N(0,1). It was designed on the base of the Wikimedia Commons file: Histogram example.svg. [commons.wikimedia.org/ wiki/ File:Histogram_ example.svg]
"In probability theory, the normal (or Gaussian) distribution is a very common continuous probability distribution. Normal distributions are important in statistics and are often used in the natural and social sciences to represent real-valued random variables whose distributions are not known." [Normal distribution. Wikipedia]
The histogram example "Normal distribution" was created using the ConceptDraw PRO diagramming and vector drawing software extended with the Histograms solution from the Graphs and Charts area of ConceptDraw Solution Park.
Histogram
Interior Design. Storage and Distribution — Design Elements

 Frequency Distribution Dashboard
Frequency distribution dashboard solution extends ConceptDraw DIAGRAM software with samples, templates and vector stencils libraries with histograms and area charts for drawing the visual dashboards showing frequency distribution of data.
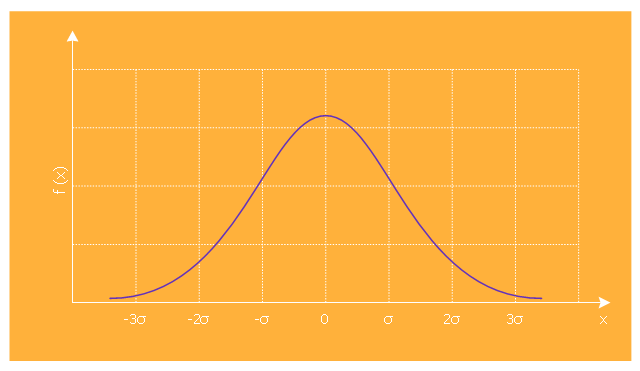
This is normal distribution graph template.
Use it to design your normal distribution graphs with ConceptDraw PRO software.
Normal (or Gaussian) distribution (bell curve) graph visualizes a continuous probability distribution that is often used as a first approximation to describe real-valued random variables that tend to cluster around a single mean value.
The marketing chart template "Normal distribution graph" is included in the Marketing Diagrams solution from the Marketing area of ConceptDraw Solution Park.
Marketing graph template
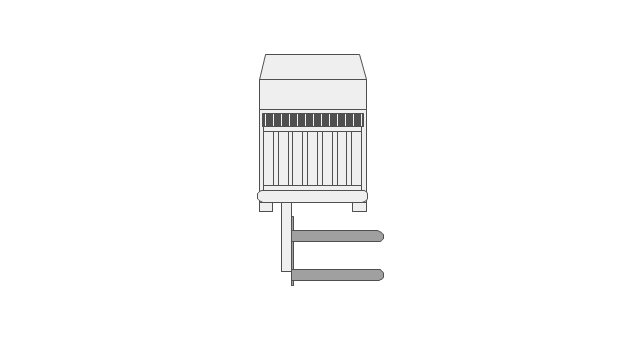
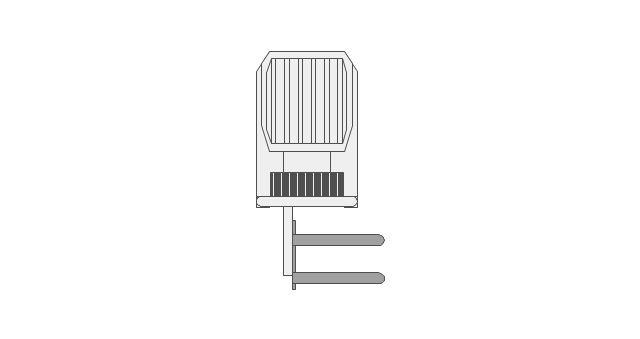
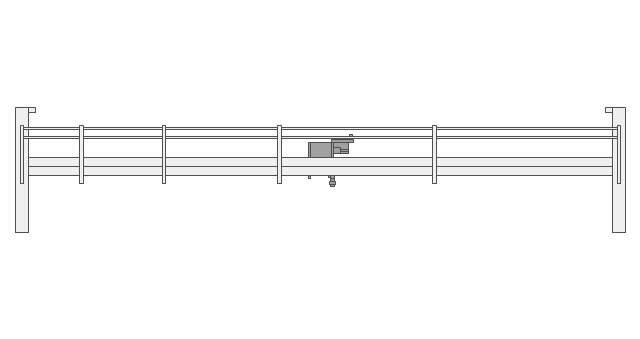
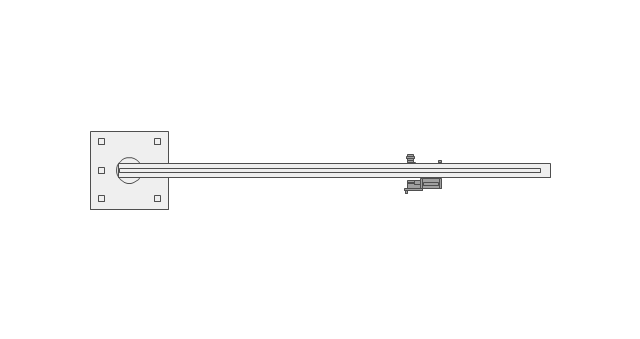
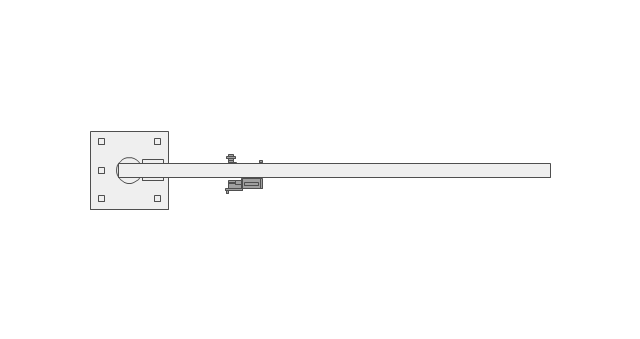
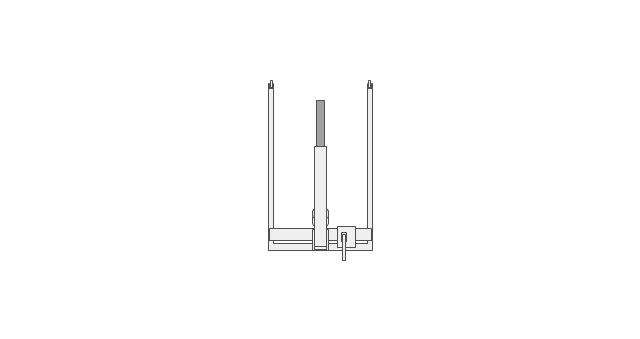
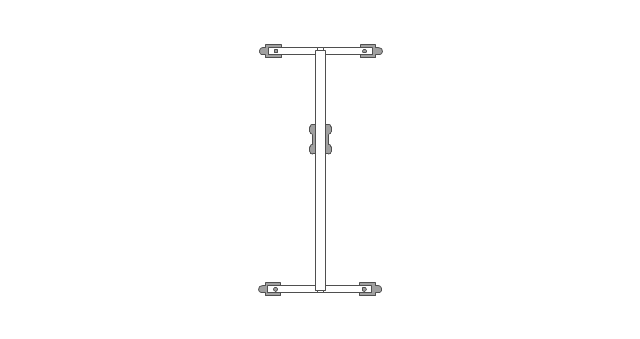
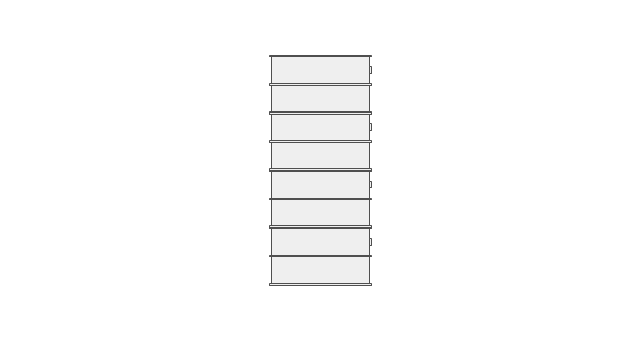
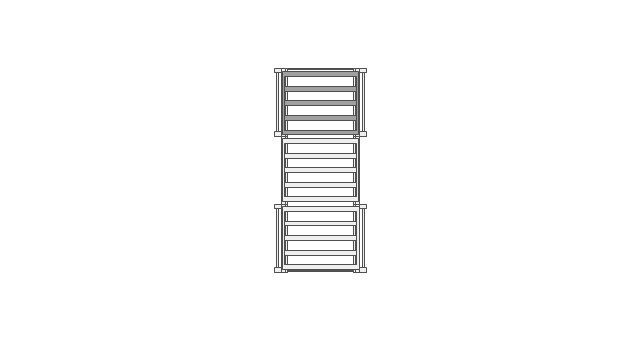
The vector stencils library "Storage and distribution" contains 24 symbols of storage and distribution industrial equipment.
Use the design elements library "Storage and distribution" to draw industrial warehouse plans and storage and distribution equipment layouts using the ConceptDraw PRO diagramming and vector drawing software.
"A warehouse is a commercial building for storage of goods. Warehouses are used by manufacturers, importers, exporters, wholesalers, transport businesses, customs, etc. They are usually large plain buildings in industrial areas of cities and towns and villages. They usually have loading docks to load and unload goods from trucks. Sometimes warehouses are designed for the loading and unloading of goods directly from railways, airports, or seaports. They often have cranes and forklifts for moving goods, which are usually placed on ISO standard pallets loaded into pallet racks.
Some of the most common warehouse storage systems are:
Pallet racking including selective, drive-in, drive-thru, double-deep, pushback, and gravity flow;
Mezzanine including structural, roll formed, racks;
Vertical Lift Modules;
Horizontal Carousels;
Vertical Carousels." [Warehouse. Wikipedia]
The shapes library "Storage and distribution" is included in the Plant Layout Plans solution from the Building Plans area of ConceptDraw Solution Park.
Storage and distribution symbols
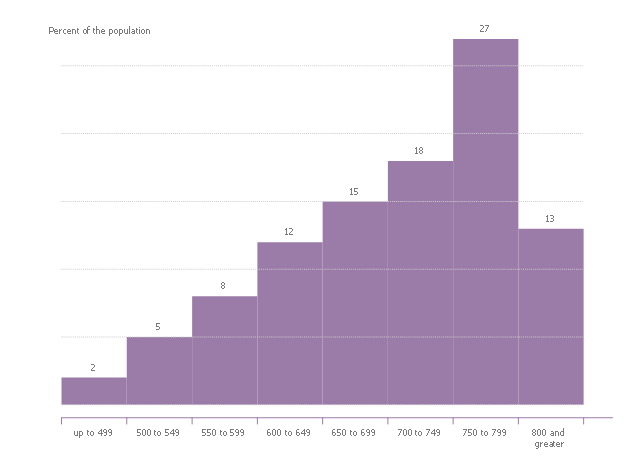
This histogram sample shows the national distribution of FICO scores in the United States. It was designed on the base of the Wikimedia Commons file: Fico histogram.svg. [commons.wikimedia.org/ wiki/ File:Fico_ histogram.svg]
This file is licensed under the Creative Commons Attribution-Share Alike 3.0 Unported license. [creativecommons.org/ licenses/ by-sa/ 3.0/ deed.en]
"The FICO score is the best-known and most widely used credit score model in the United States. It was first introduced in 1989 by FICO, then called Fair, Isaac, and Company. The FICO model is used by the vast majority of banks and credit grantors, and is based on consumer credit files of the three national credit bureaus: Experian, Equifax, and TransUnion. Because a consumer's credit file may contain different information at each of the bureaus, FICO scores can vary depending on which bureau provides the information to FICO to generate the score." [Credit score in the United States. Wikipedia]
The histogram example "National distribution of FICO scores" was created using the ConceptDraw PRO diagramming and vector drawing software extended with the Histograms solution from the Graphs and Charts area of ConceptDraw Solution Park.
Histogram
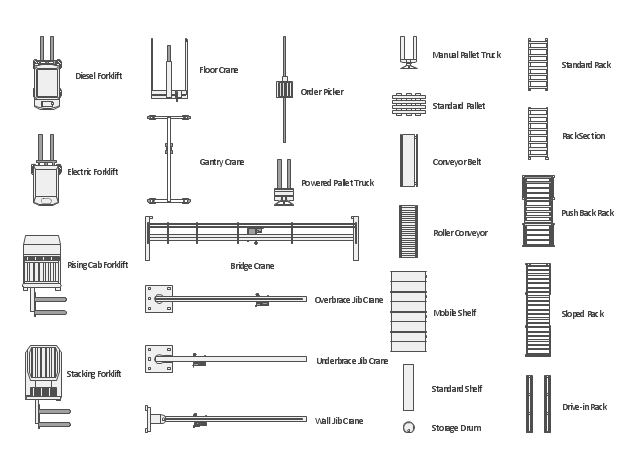
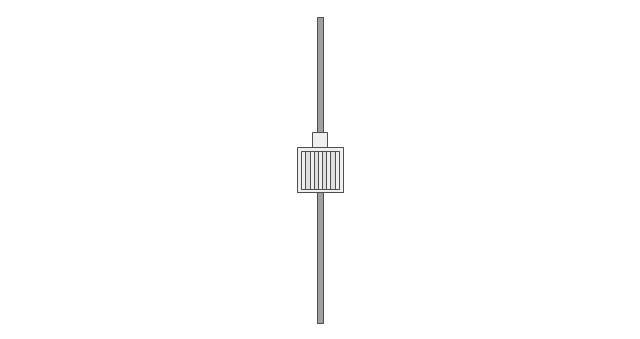
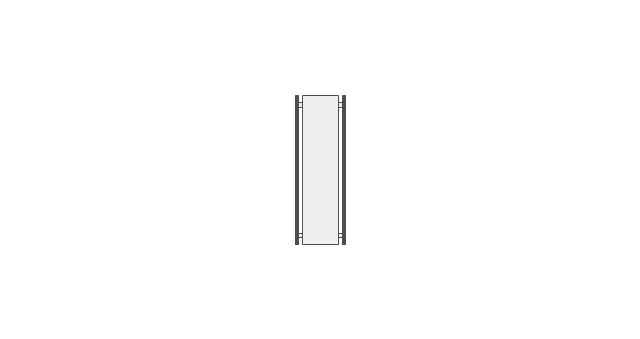
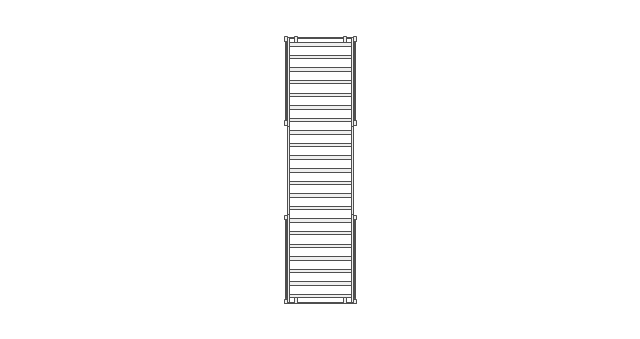
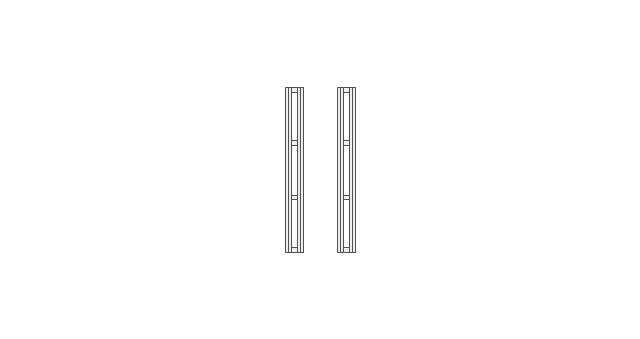
The vector stencils library "Storage and distribution" contains 24 symbols of storage and distribution equipment.
Use it for drawing plant design plans and equipment layouts in the ConceptDraw PRO diagramming and vector drawing software extended with the Plant Layout Plans solution from the Building Plans area of ConceptDraw Solution Park.
www.conceptdraw.com/ solution-park/ building-plant-layout-plans
Use it for drawing plant design plans and equipment layouts in the ConceptDraw PRO diagramming and vector drawing software extended with the Plant Layout Plans solution from the Building Plans area of ConceptDraw Solution Park.
www.conceptdraw.com/ solution-park/ building-plant-layout-plans
Diesel forklift

Electric forklift

Rising cab forklift
Stacking forklift
Manual pallet truck

Order picker
Powered pallet truck

Standard pallet

Conveyor belt
Bridge crane
Roller conveyor

Overbrace jib crane
Underbrace jib crane
Wall jib crane

Floor crane
Gantry crane
Mobile shelf
Standard shelf

Standard rack
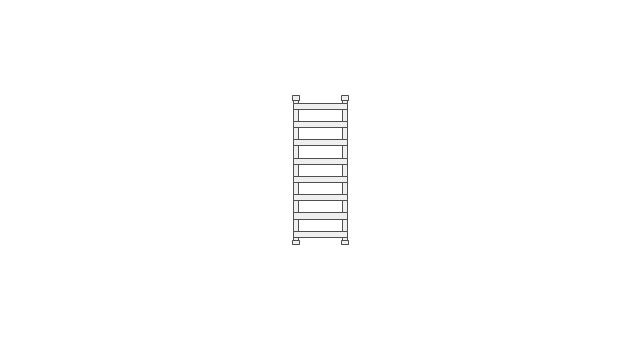
Rack section
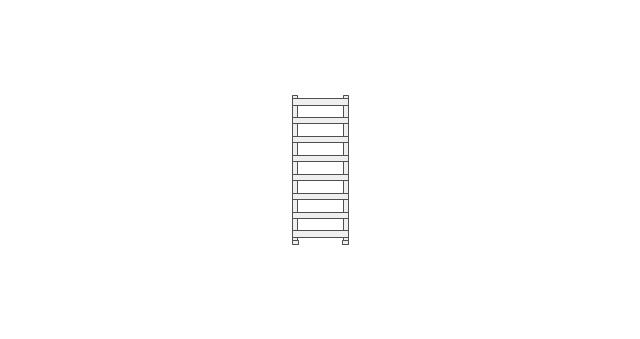
Push back rack
Sloped rack
Drive-in rack
Storage drum

"A thematic map is a type of map or chart especially designed to show a particular theme connected with a specific geographic area. ...
A thematic map is a map that focuses on a specific theme or subject area, whereas in a general map the variety of phenomena - geological, geographical, political - regularly appear together. ...
Thematic maps emphasize spatial variation of one or a small number of geographic distributions. These distributions may be physical phenomena such as climate or human characteristics such as population density and health issues. ...
Thematic map are sometimes referred to as graphic essays that portray spatial variations and interrelationships of geographical distributions. Location, of course, is important to provide a reference base of where selected phenomena are occurring. ...
Thematic maps serve three primary purposes.
First, they provide specific information about particular locations.
Second, they provide general information about spatial patterns.
Third, they can be used to compare patterns on two or more maps." [Thematic map. Wikipedia]
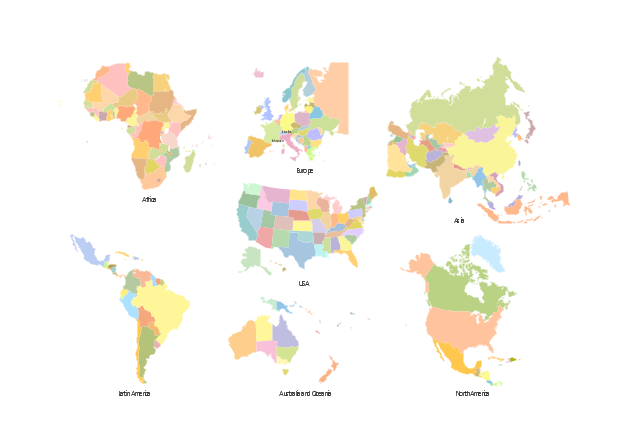
The vector stencils library "Thematic maps" contains 7 continent map contours for creating the thematic maps of geographic regions displaying the metric values by countries, states and territories marked by different colors.
Use the design elements library "Thematic maps" to create spatial dashboards using the ConceptDraw PRO diagramming and vector drawing software for your Spatial Intelligence and Location Intelligence business practice.
The example "Design elements - Thematic maps" is included in the Spatial Dashboard solution from the area "What is a Dashboard" of ConceptDraw Solution Park.
A thematic map is a map that focuses on a specific theme or subject area, whereas in a general map the variety of phenomena - geological, geographical, political - regularly appear together. ...
Thematic maps emphasize spatial variation of one or a small number of geographic distributions. These distributions may be physical phenomena such as climate or human characteristics such as population density and health issues. ...
Thematic map are sometimes referred to as graphic essays that portray spatial variations and interrelationships of geographical distributions. Location, of course, is important to provide a reference base of where selected phenomena are occurring. ...
Thematic maps serve three primary purposes.
First, they provide specific information about particular locations.
Second, they provide general information about spatial patterns.
Third, they can be used to compare patterns on two or more maps." [Thematic map. Wikipedia]
The vector stencils library "Thematic maps" contains 7 continent map contours for creating the thematic maps of geographic regions displaying the metric values by countries, states and territories marked by different colors.
Use the design elements library "Thematic maps" to create spatial dashboards using the ConceptDraw PRO diagramming and vector drawing software for your Spatial Intelligence and Location Intelligence business practice.
The example "Design elements - Thematic maps" is included in the Spatial Dashboard solution from the area "What is a Dashboard" of ConceptDraw Solution Park.
Thematic map templates
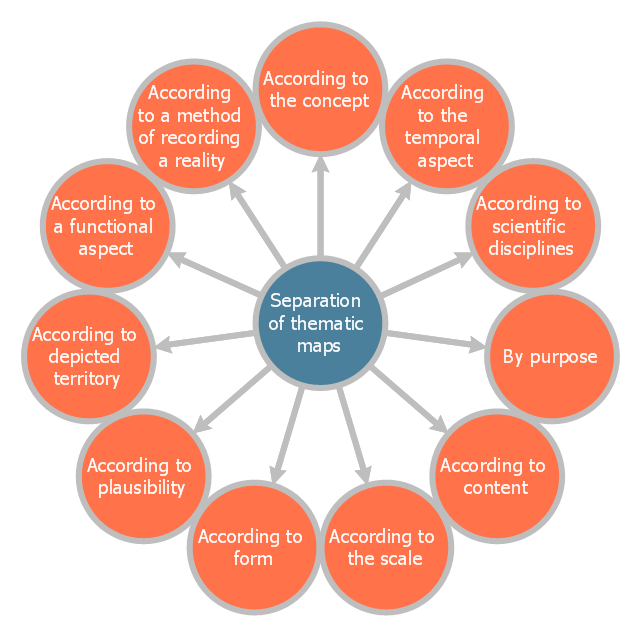
This circle-spoke diagram sample shows the basic division of thematic maps. It was designed on the base of the Wikimedia Commons file: Dělení tematických map.png.
[commons.wikimedia.org/ wiki/ File:D%C4%9Blen%C3%AD_ tematick%C3%BDch_ map.png]
This file is licensed under the Creative Commons Attribution-Share Alike 4.0 International license. [creativecommons.org/ licenses/ by-sa/ 4.0/ deed.en]
"A thematic map is a map that focuses on a specific theme or subject area. This is in contrast to general reference maps, which regularly show the variety of phenomena — geological, geographical, political — together. The contrast between them lies in the fact that thematic maps use the base data, such as coastlines, boundaries and places, only as points of reference for the phenomenon being mapped. General maps portray the base data, such as landforms, lines of transportation, settlements, and political boundaries, for their own sake.
Thematic maps emphasize spatial variation of one or a small number of geographic distributions. These distributions may be physical phenomena such as climate or human characteristics such as population density and health issues." [Thematic map. Wikipedia]
The hub-and-spoke diagram example "Division of thematic maps" was created using the ConceptDraw PRO diagramming and vector drawing software extended with the Circle-Spoke Diagrams solution from the area "What is a Diagram" of ConceptDraw Solution Park.
Circle-spoke diagram
How To Make a Histogram?

This circle-spoke diagram sample shows the social determinants of health. It was created on the base of the hub-and-spoke diagram from the Health Canada website. [hc-sc.gc.ca/ sr-sr/ pubs/ hpr-rpms/ bull/ 2005-climat/ 2005-climat-6-eng.php]
"Social determinants of health are the economic and social conditions – and their distribution among the population – that influence individual and group differences in health status. They are risk factors found in one's living and working conditions (such as the distribution of income, wealth, influence, and power), rather than individual factors (such as behavioural risk factors or genetics) that influence the risk for a disease, or vulnerability to disease or injury. According to some viewpoints, these distributions of social determinants are shaped by public policies that reflect the influence of prevailing political ideologies of those governing a jurisdiction. ...
In 2003, the World Health Organization (WHO) Europe suggested that the social determinants of health included:
(1) Social gradients (life expectancy is shorter and disease is more common further down the social ladder).
(2) Stress (including stress in the workplace).
(3) Early childhood development.
(4) Social exclusion.
(5) Unemployment.
(6) Social support networks.
(7) Addiction.
(8) Availability of healthy food.
(9) Availability of healthy transportation." [Social determinants of health. Wikipedia]
The hub-and-spoke diagram example "Social determinants of health" was created using the ConceptDraw PRO diagramming and vector drawing software extended with the Circle-Spoke Diagrams solution from the area "What is a Diagram" of ConceptDraw Solution Park.
Circle-spoke diagram

- Normal distribution graph - Template | Normal distribution | Normal ...
- Normal (Gaussian) distribution graph | Normal distribution graph ...
- Probability Distribution
- Social determinants of health
- Normal distribution graph - Template | Marketing Diagrams ...
- Distribution Process Flow Chart
- Prepare A Chart For Distribution Network For Different Products
- Employee distribution - HR dashboard | How to Create a HR ...
- Diagrams For Social Determinants Of Health
- Frequency Distribution Dashboard | Flow chart Example ...
- Simple Products Marketing And Distribution Process Flow Chart
- Building Drawing Design Element: Storage and Distribution | Interior ...
- Involvement matrix - Distribution of responsibilities | CORRECTIVE ...
- Visualization Spatial Data Using Thematic Maps Combined with ...
- 3 Phase Distribution Board Wiring Diagram Symbol
- Frequency Distribution Dashboard | Activity Network Diagram ...
- 3phase Electrical Distribution Board Symbol
- Soccer | Ice Hockey | Distribution Of Positions Of Players In Football ...
- Interior Design Shipping and Receiving - Design Elements | Interior ...