Technical Drawing Software
In conditions of rapidly developing and progressing modern technologies in various fields of science and technics, a powerful specialized software is very popular and highly demanded today. In this area particularly valuable is a technical drawing software. ConceptDraw PRO is a unique professional vector diagramming software for business and technical drawing. Enhanced with powerful drawing tools of Mechanical Engineering solution from the Engineering area of ConceptDraw Solution Park, it is ideal for designing Technical Drawings, Electrical Schematics, Mechanical Systems Drawings, Plumbing Drawings, Structural Drawings, Architectural Drawings, Circuit Diagrams, and many other types of technical diagrams and schematics of any degree of complexity and any level of detailing. Included numerous predesigned mechanical engineering and technical drawing objects and symbols make a technical drawing process as simple as possible. Besides, ConceptDraw PRO offers extensive export capabilities that promote the active exchange of ideas and results with colleagues and other stakeholders.SysML
Systems Modeling Language (SysML) is a general-purpose modeling language for systems engineering applications. ConceptDraw PRO diagramming and vector drawing software was extended with SysML Solution from the Software Development Area of ConceptDraw Solution Park specially to help systems engineers design various model systems with SysML.Martin ERD Diagram
The vector stencils library Crow's Foot Notation from the solution Entity-Relationship Diagrams (ERD) contains specific symbols of the Crow's foot notation such as relationship symbols and entity symbols for ConceptDraw PRO diagramming and vector drawing software. The Entity-Relationship Diagrams (ERD) solution is contained in the Software Development area of ConceptDraw Solution Park.
 AWS Architecture Diagrams
The flexible AWS cloud solutions will help you to create reliable applications with a high level of scaling in the AWS cloud, to run your applications and accelerate their work on the level of security. Besides AWS resources are available worldwide and yo
 Entity-Relationship Diagram (ERD)
An Entity-Relationship Diagram (ERD) is a visual presentation of entities and relationships. That type of diagrams is often used in the semi-structured or unstructured data in databases and information systems. At first glance ERD is similar to a flowch
 Entity-Relationship Diagram (ERD)
Entity-Relationship Diagram (ERD) solution extends ConceptDraw PRO software with templates, samples and libraries of vector stencils from drawing the ER-diagrams by Chen's and crow’s foot notations.
 Safety and Security
Safety and security solution extends ConceptDraw PRO software with illustration samples, templates and vector stencils libraries with clip art of fire safety, access and security equipment.
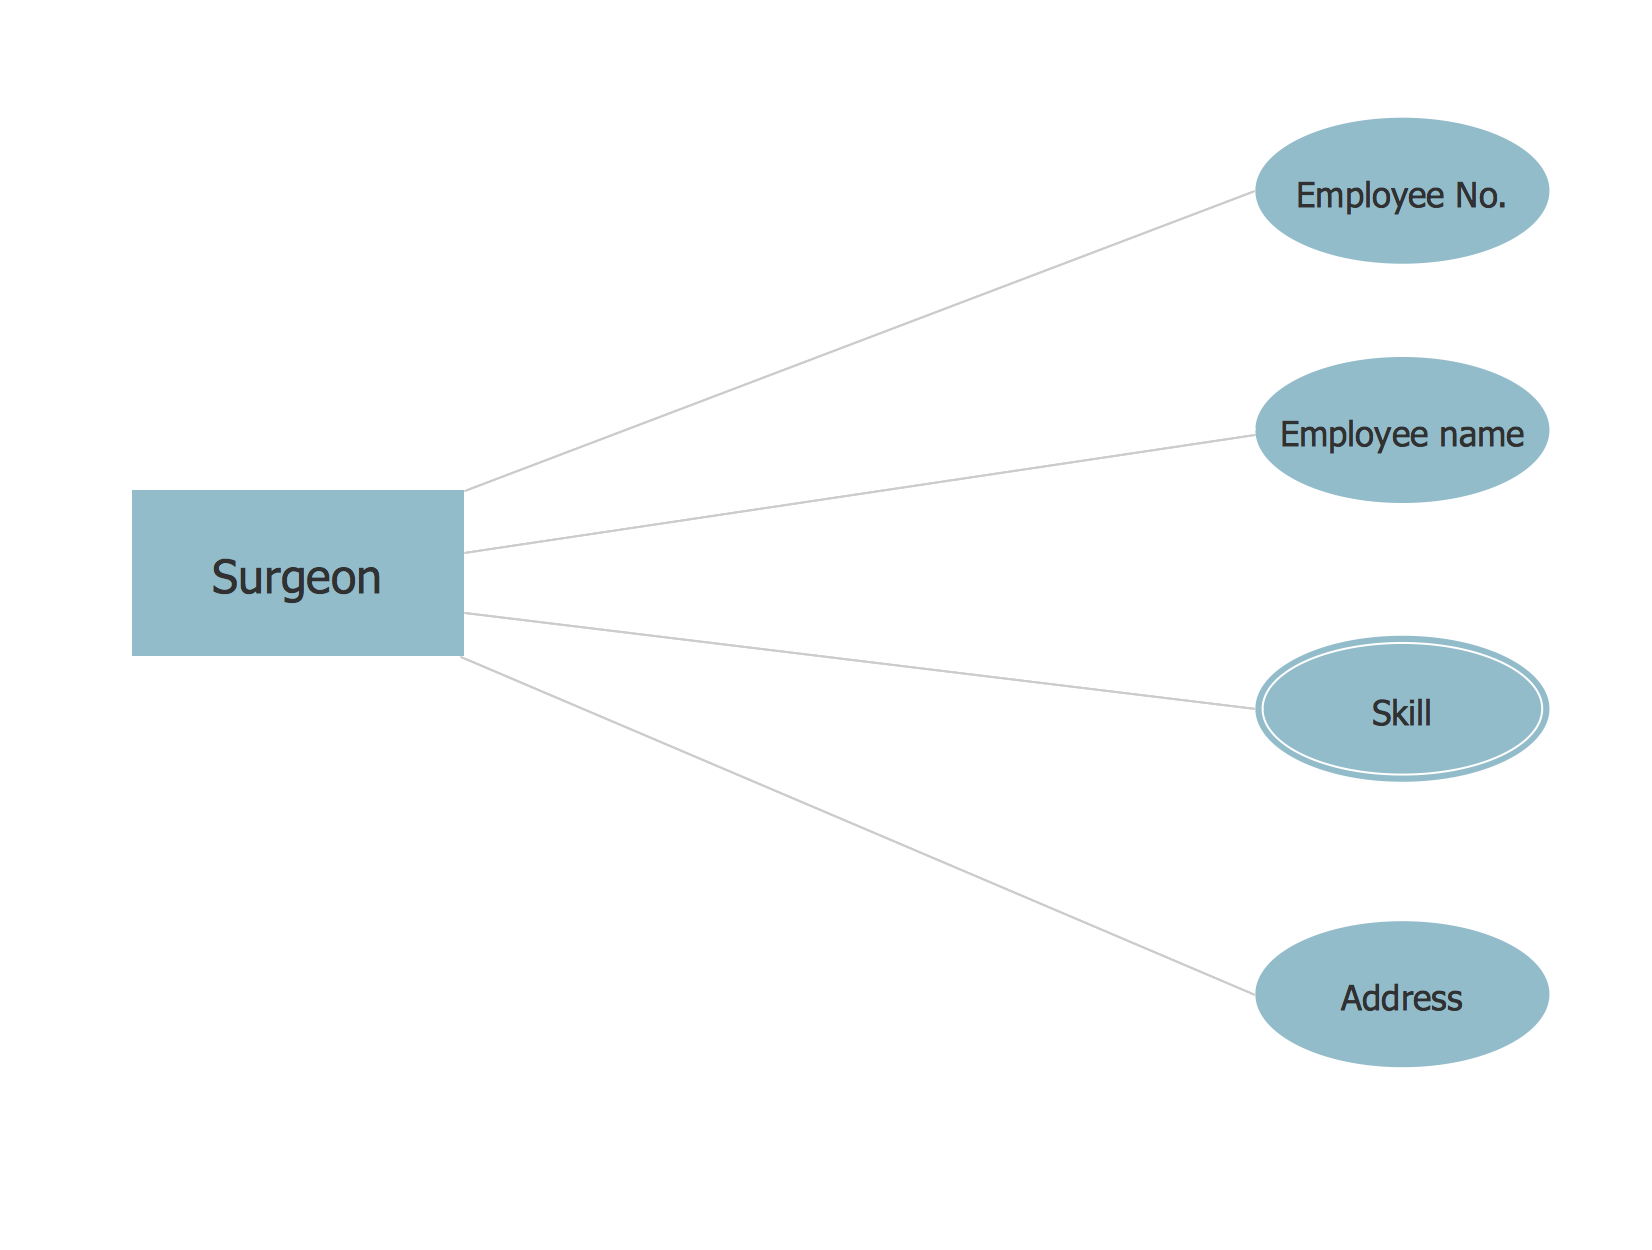
Chen ERD Diagram
The vector stencils library Chen ERD from the solution Entity-Relationship Diagrams (ERD) contains specific symbols of the Chen ERD notation including entity symbols and relationship symbols for ConceptDraw PRO diagramming and vector drawing software. The Entity-Relationship Diagrams (ERD) solution is contained in the Software Development area of ConceptDraw Solution Park.Data Modeling with Entity Relationship Diagram
Data modeling is actively applied in analysis and uses wide set of methods for description the data requirements in a system. One of the most popular and well-known is the ERD method of database modeling. The best ERD tool for the Mac and Windows is ConceptDraw PRO software extended with the Entity-Relationship Diagram (ERD) solution from the Software Development Area for ConceptDraw Solution Park, which is sharpened for professional ERD drawing and data modeling with Entity Relationship Diagram.
 Fishbone Diagrams
The Fishbone Diagrams solution extends ConceptDraw PRO v10 software with the ability to easily draw the Fishbone Diagrams (Ishikawa Diagrams) to clearly see the cause and effect analysis and also problem solving. The vector graphic diagrams produced using this solution can be used in whitepapers, presentations, datasheets, posters, and published technical material.
- Block Diagram Creator | Block Diagrams | Technical Drawing ...
- Mechanical Engineering | Total Quality Management TQM Diagrams ...
- Electrical Engineering | Electric and Telecom Plans | Fishbone ...
- Fishbone Diagrams | Engineering | Chemical Engineering ...
- Manufacturing Block Diagrams
- Fishbone Diagrams | Engineering | Mechanical Engineering | Fish ...
- Fishbone Diagrams | Fishbone Diagram | Engineering | Engineering ...
- Process Flowchart | Engineering | Data Flow Diagrams (DFD) | Flow ...
- Block diagram - Total solution process | Process Flowchart ...
- Block diagram - Document management system architecture | Block ...
- Block Diagram Of Maintenance In Manufacturing Plant
- Block Diagrams | Telecommunication Network Diagrams | Seating ...
- HVAC Marketing Plan | Piping and Instrumentation Diagram ...
- How to Draw a Block Diagram in ConceptDraw PRO
- Developing Entity Relationship Diagrams | ERD Symbols and ...
- Circuits and Logic Diagram Software | Network Diagram Software ...
- Fishbone Diagrams | Block Diagram Creator | Business Tools ...
- ERD Symbols and Meanings | Block Diagram Creator | Network ...
- Fishbone Diagram In Software Requirements Engineering
- Circuits and Logic Diagram Software | Network Diagramming ...


