UML Collaboration Diagram (UML2.0)
How To draw UML Collaboration Diagrams
UML Collaboration Diagram depicts the interactions between objects or parts in terms of sequenced messages and describes both the static structure and dynamic behavior of a system. ConceptDraw has four examples that will help you to start using software for drawing UML Collaboration Diagrams. You can also use the appropriate stencils of UML notation to draw your own UML Collaboration Diagram.

Example 1. UML Collaboration Diagram Symbols

Example 2. UML collaboration diagram. Online bookshop
This UML collaboration diagram sample is created using ConceptDraw DIAGRAM diagramming and vector drawing software enhanced with Rapid UML solution from ConceptDraw Solution Park.

Example 3.UML Diagrams solution
Rapid UML solution provides templates, examples and libraries of stencils for quick and easy drawing all the types of system and software engineering diagrams according to UML 2.4 and 1.2 notations.

Example 4. UML Collaboration Diagram Template


Example 5. UML Collaboration Diagram Samples (MAC OS X and Windows)
Use ConceptDraw DIAGRAM with UML communication and collaboration diagrams templates, samples and stencil libraries from Rapid UML solution to show the interactions between objects or parts of your system in terms of sequenced messages.
TEN RELATED HOW TO's:
UML Component for Bank - This sample was created in ConceptDraw DIAGRAM diagramming and vector drawing software using the UML Component Diagram library of the Rapid UML Solution from the Software Development area of ConceptDraw Solution Park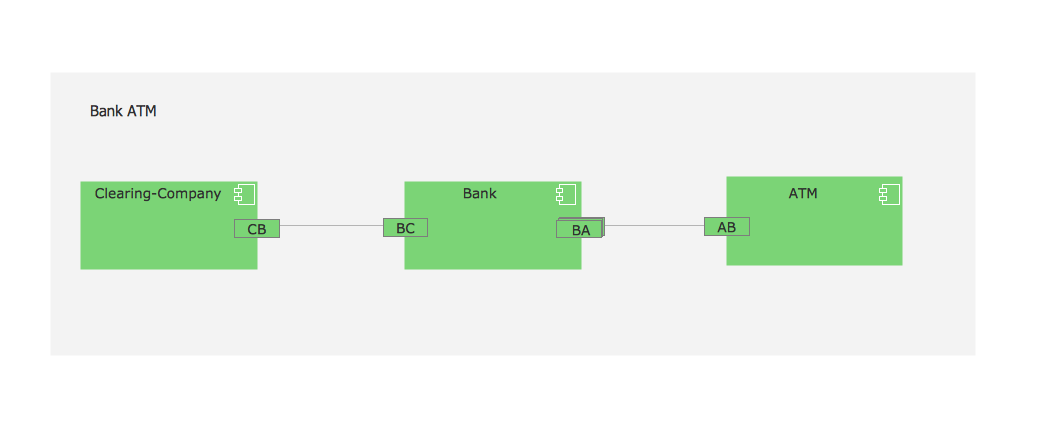
Picture: UML Component for Bank
Related Solution:
This sample shows the Data Flow Diagram of the Taxi Service and interactions between the Clients, Operators and Divers, as well as Orders and Reports databases.
Picture: Taxi Service Data Flow DiagramDFD Example
Related Solution:
You need design a Bank UML Diagram? Now, thanks to the ConceptDraw DIAGRAM diagramming and vector drawing software extended with ATM UML Diagrams Solution from the Software Development Area, you can design without efforts any type of Bank UML Diagram you want - Class, Activity, Communication, Component, Composite structure, Deployment, Interaction overview, Object, Package, Profile, Sequence, State machine, Timing, Use case.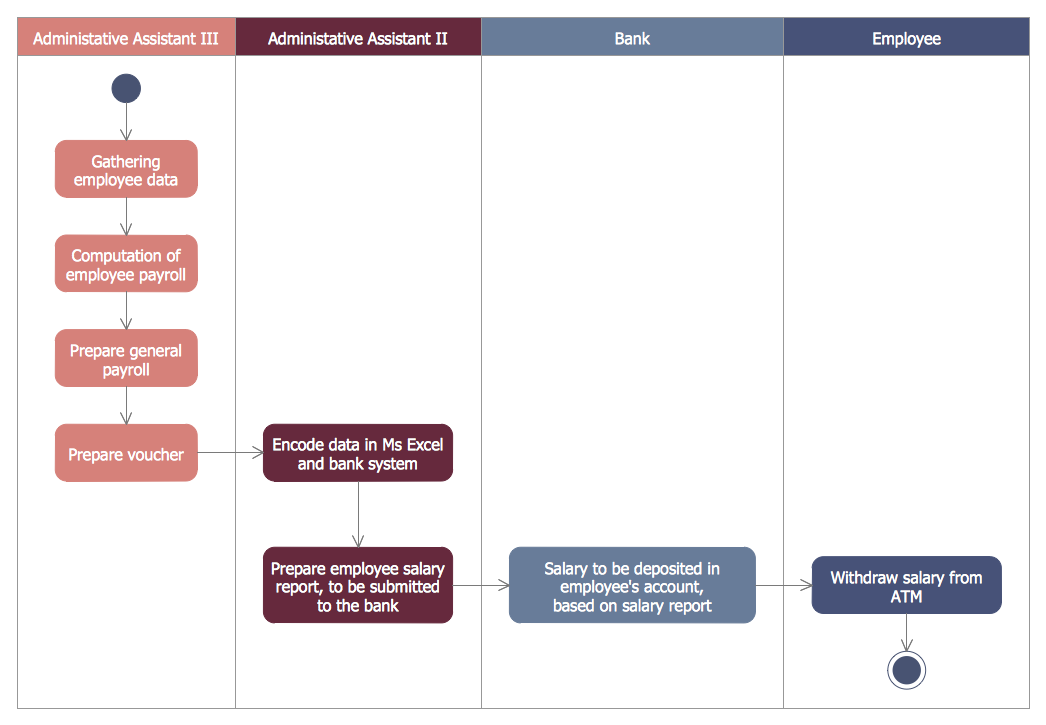
Picture: Bank UML Diagram
Related Solution:
How to Draw ER Diagrams? With Entity-Relationship Diagram (ERD) solution from the Software Development Area for ConceptDraw Solution Park you are able to draw ER diagram with no problem. It includes 45 predesigned icons advocated by popular Chen's and Crow’s Foot notations that can be used when describing an enterprise database.
Picture: How to Draw ER Diagrams
Related Solution:
Stakeholder management is a critical component to the successful delivery of any project, programme or activity.
ConceptDraw DIAGRAM is a powerful diagramming and vector drawing software. Now, thanks to the Stakeholder Onion Diagrams Solution included to the Management Area of ConceptDraw Solution Park, ConceptDraw DIAGRAM became also unique stakeholder management system design software.
Picture: Stakeholder Management System using Onion Diagram
Related Solution:
UML Deployment Diagram depicts the physical deployment of artifacts on nodes (nodes are the existing hardware components, artifacts are the software components running on each node); and how the different pieces are connected.
Use ConceptDraw DIAGRAM with UML deployment diagram templates, samples and stencil library from Rapid UML solution to model the physical deployment of artifacts on nodes of your software system.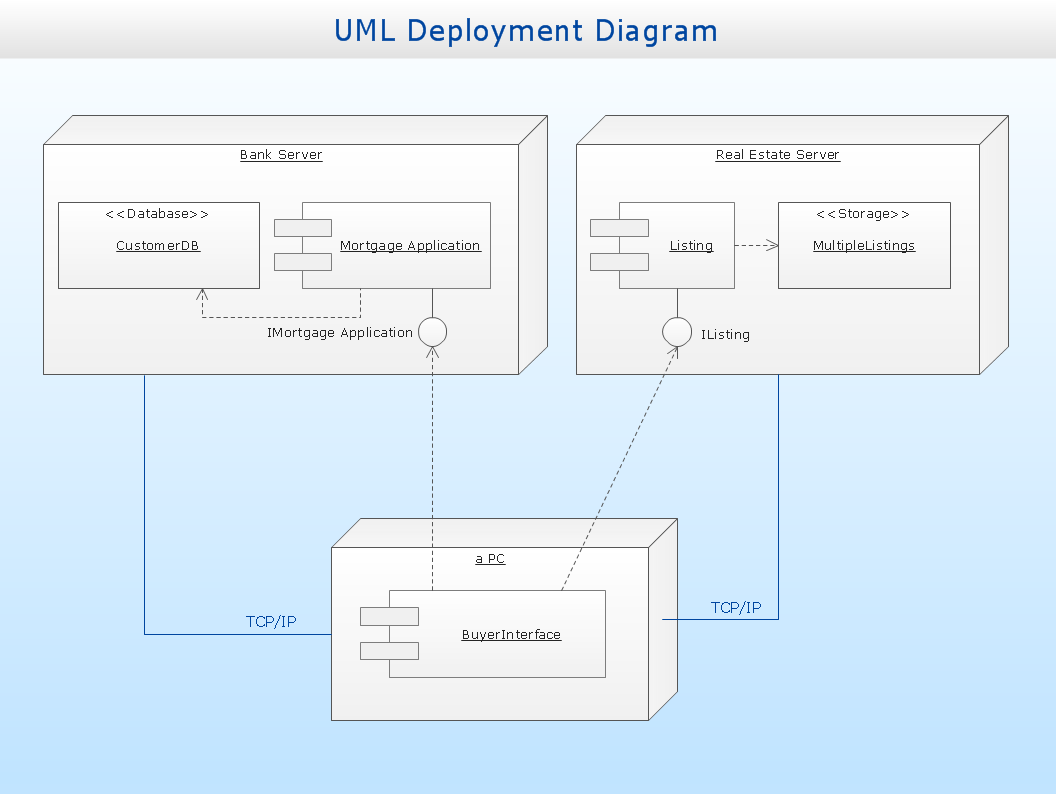
Picture: UML Deployment Diagram
Related Solution:
If you want to find a way to understand complex things in minutes, you should try to visualize data. One of the most useful tool for this is creating a flowchart, which is a diagram representing stages of some process in sequential order. There are so many possible uses of flowcharts and you can find tons of flow charts examples and predesigned templates on the Internet. Warehouse flowchart is often used for describing workflow and business process mapping. Using your imagination, you can simplify your job or daily routine with flowcharts.
Warehouse flowcharts are used to document product and information flow between sources of supply and consumers. The flowchart provides the staged guidance on how to manage each aspect of warehousing and describes such aspects as receiving of supplies; control of quality; shipment and storage and corresponding document flow. Warehouse flowchart, being actual is a good source of information. It indicates the stepwise way to complete the warehouse and inventory management process flow. Also it can be very useful for an inventory and audit procedures.
Picture: Flow chart Example. Warehouse Flowchart
Related Solution:


