Made with
ConceptDraw
MINDMAP 16

Task Board

Project Management

In PM solutions we support many project methodologies such as Agile and Simple Projects. Methodology solutions help in implementing best practices in project management. CS Odessa provides Toolbox solutions to support solving issues related to planning, tracking, milestones, events, resource usage, and other typical project management functions. Toolbox Solutions help you deal with common project situations in an extraordinary way.

PM Agile

Benefits

All Agile meetings and documents are powered by mission adapted mind map templates, specially tuned for collaborative work. Tracking project Velocity is easy when using ConceptDraw Velocity diagram templates.

Objective

Support Agile methods such as user stories, iteration planning, burndown charts, backlogs, and velocity.

Solution Purpose

These visual tools assist in the holding of Scrum-meetings, collaborative planning for Sprint, maintaining backlog, and calculating and reporting the Velocity of the team.

Intended For

Companies using Agile methodology; specifically, Scrum; Product Owners, Scrum Masters.

Products and methods

In the background of this solution we use mind mapping for visualization of key events and artifacts of Agile methodology. Key diagrams for visualization are made by ConceptDraw DIAGRAM

Use Task Board to visualize the Scrum-ban Task Board as a mind map.

Task Board *

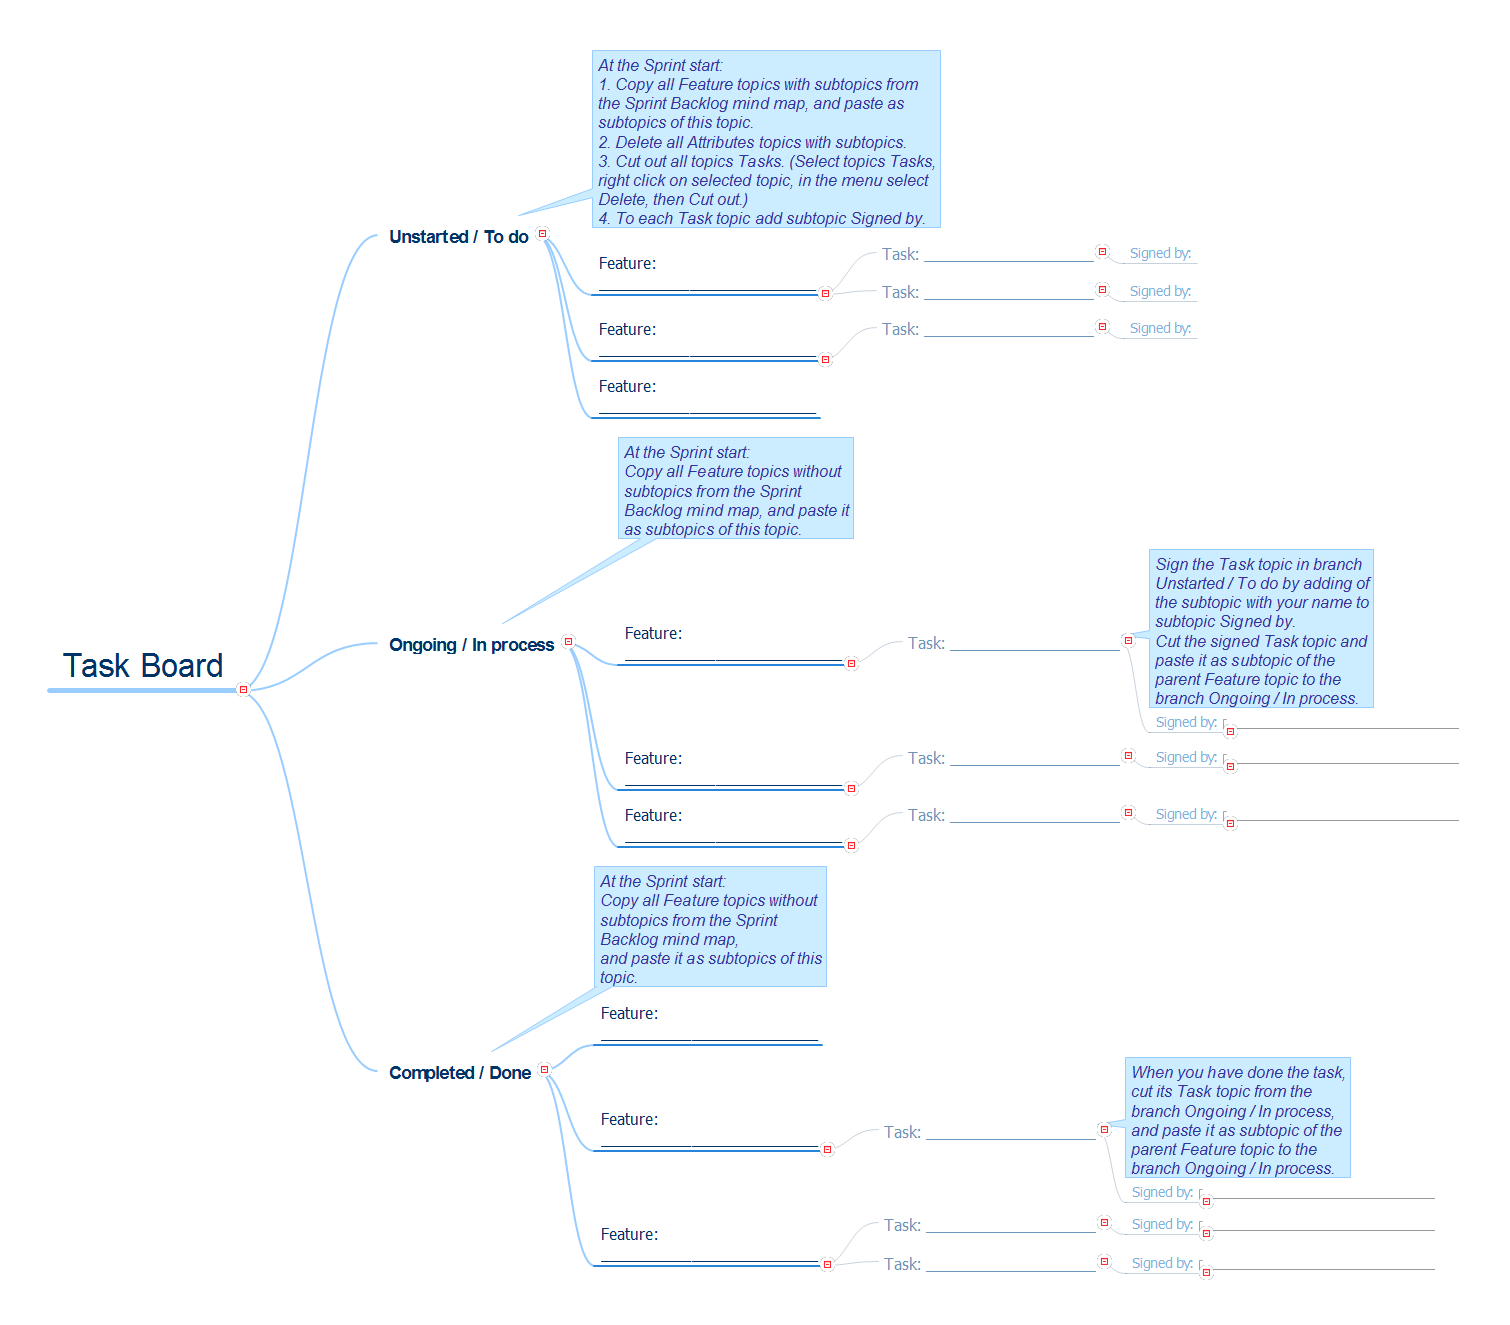
Example 1. Task Board


Export to Outline


Weekend To-Do List
    Task Board
    • Unstarted / To do
      • Feature: ________________________
        • Task: _____________________
          • Signed by:
        • Task: _____________________
          • Signed by:
      • Feature: ________________________
        • Task: _____________________
          • Signed by:
      • Feature: ________________________
    • Ongoing / In process
      • Feature: ________________________
        • Task: _____________________
          • Signed by:
            • ________________________________
      • Feature: ________________________
        • Task: _____________________
          • Signed by:
            • ________________________________
      • Feature: ________________________
        • Task: _____________________
          • Signed by:
            • ________________________________
    • Completed / Done
      • Feature: ________________________
      • Feature: ________________________
        • Task: _____________________
          • Signed by:
            • ________________________________
      • Feature: ________________________
        • Task: _____________________
          • Signed by:
            • ________________________________
        • Task: _____________________
          • Signed by:
            • ________________________________

The Benefits for ConceptDraw MINDMAP Brainstorming Software

  • ConceptDraw MINDMAP is effective for brainstorming, designing mind maps, idea generating, creative and lateral thinking, creativity and problem solving.
  • ConceptDraw MINDMAP is ideal for team and personal work in Business, Marketing and Project Management.
  • The libraries with large quantity of vector objects help to illustrate your mind maps and to make them bright, visual and comprehensible.
  • Use of View Navigator tool lets create presentations from a mind map: you can simply select the map parts you want to present, sequence your slides, and preview the presentation.
  • ConceptDraw MINDMAP provides wide capabilities of importing and exporting in various formats: Microsoft PowerPoint, Microsoft Word, MS Excel, Mindjet MindManager, image, HTML, PDF file.


FIVE RELATED HOW TO's:
The first step to improve your workflow is to draw it down. When the workflow is visualised you are able to analyse it, to find excess or missing steps or relations. Changing the workflow on paper you can pass as many iterations as needed to get the optimal process, and then start implementing changes to the real process. The best software helps you with workflow is ConceptDraw DIAGRAM software extended with the Workflow Diagram solution. It contains all tools, features, samples and templates you may need during drawing workflow, analysis, and then presenting and implementing your results.Tools and Software to Improve Your Workflow *
Picture: Tools and Software to Improve Your Workflow
Related Solution:
Learn about Systems Engineering, its process and discover practical examples illustrated through diagrams. ✔️ How to draw Systems Engineering diagrams using the ConceptDraw DIAGRAM software?Systems Engineering
Picture:
What is a Systems Engineering?
Examples of Systems Engineering Diagrams
Related Solution:
Block diagrams solution extends ConceptDraw DIAGRAM software with templates, samples and libraries of vector stencils for creating the block diagram. Create block diagrams, electrical circuit diagrams, schematics, and more in minutes with ConceptDraw DIAGRAM.Create Block Diagram *
Picture: Create Block Diagram
It’s not easy to plan all the details of your landscape at once. Therefore, you can use a bubble diagram to create a draft of the future project. You can develop any bubble diagrams and use them in your landscape design project with ConceptDraw DIAGRAM and it’s predesigned templates. This bubble diagram can be applied while initiating the development of garden and landscape design. The bubble diagrams used for this purpose are different from the classic bubble diagrams. Being used in landscape and garden design, they obtain the quite another understanding. Bubbles in this diagram visualize some captured areas, which define the general spaces of a future garden: lawn, flower garden, pool, built-up area, lighting, etc. The bubble diagram represents the landscape project without any special expenses on its creation. It is better to make such simple sketch before you drill down into detailed project and cost estimates.Bubble diagrams in Landscape Design with ConceptDraw DIAGRAM
Picture: Bubble diagrams in Landscape Design with ConceptDraw DIAGRAM
While creating flowcharts and process flow diagrams, you should use special objects to define different statements, so anyone aware of flowcharts can get your scheme right. There is a short and an extended list of basic flowchart symbols and their meaning. Basic flowchart symbols include terminator objects, rectangles for describing steps of a process, diamonds representing appearing conditions and questions and parallelograms to show incoming data. This diagram gives a general review of the standard symbols that are used when creating flowcharts and process flow diagrams. The practice of using a set of standard flowchart symbols was admitted in order to make flowcharts and other process flow diagrams created by any person properly understandable by other people. The flowchart symbols depict different kinds of actions and phases in a process. The sequence of the actions, and the relationships between them are shown by special lines and arrows. There are a large number of flowchart symbols. Which of them can be used in the particular diagram depends on its type. For instance, some symbols used in data flow diagrams usually are not used in the process flowcharts. Business process system use exactly these flowchart symbols.Flowchart example showing a customer request approval process with start, input output, process steps, decision branches, and end
Picture: Flowchart Symbols: Meaning and Examples
Related Solution:
ConceptDraw
MINDMAP 16