Data Modeling with Entity Relationship Diagram
Data modeling is actively applied in analysis and uses wide set of methods for description the data requirements in a system. One of the most popular and well-known is the ERD method of database modeling, which lets produce conceptual, logical and physical data models of a system representing the levels of abstraction in database design and data modeling. Physical model lets to represent the physical schematic of a database, conceptual and logical data models give the representation of databases on the level of tables.
The best ERD tool for the Mac and Windows is ConceptDraw DIAGRAM software extended with the Entity-Relationship Diagram (ERD) solution from the Software Development Area for ConceptDraw Solution Park, which is sharpened for professional ERD drawing and data modeling with Entity Relationship Diagram.

Example 1. Data Modeling with Entity Relationship Diagram
Entity-Relationship Diagram (ERD) solution for ConceptDraw DIAGRAM has examples, samples and templates, and 2 libraries with numerous quantity of vector objects for fast and easy data modeling with Entity Relationship Diagram.

Example 2. ERD Templates
The vector graphic Entity Relationship Diagrams designed in ConceptDraw DIAGRAM to visualize the logical structure of databases can be a perfect accent for whitepapers, presentations, datasheets, posters, or any technical materials.

Example 3. Entity-Relationship Model Diagram
The samples you see on this page were created in ConceptDraw DIAGRAM using the libraries from Entity-Relationship Diagram (ERD) Solution and demonstrate the process of data modeling with Entity Relationship Diagram. An experienced user spent 10-15 minutes creating each of these samples.
Use the Entity-Relationship Diagram (ERD) Solution for ConceptDraw DIAGRAM software for quick, easy and effective drawing ER diagrams and data modeling.
All source documents are vector graphic documents. They are available for reviewing, modifying, or converting to a variety of formats (PDF file, MS PowerPoint, MS Visio, and many other graphic formats) from the ConceptDraw STORE. The Entity-Relationship Diagram (ERD) Solution is available for all ConceptDraw DIAGRAM users.
NINE RELATED HOW TO's:
How to draw pictorial chart quick, easy and effective? ConceptDraw DIAGRAM offers the unique Pictorial Infographics Solution that will help you!
Pictorial Infographics solution contains large number of libraries with variety of predesigned vector pictograms that allows you design infographics in minutes. There are available 10 libraries with 197 vector pictograms.
Picture: How to Draw Pictorial Chart. How to Use Infograms
Related Solution:
While developing software, it is very important to have a visual model, because it helps to represent the logic and the architecture of an application. Experienced engineers use UML diagrams to denote relationships between classes and their instances. UML is a general language for a set of diagrams like deployment diagrams, object diagrams or use case diagrams.
This diagram represents UML class diagram used for a software system development using an object-oriented method. Class diagrams are categorized as static structure diagrams that depict the physical structure of a system. Class diagram divides a software system's structure into "classes". Classes are defined by the methods and variables of objects. UML Class diagram is used to depict relationships and source code dependencies between objects.
Picture: UML Diagram
Related Solution:
This sample was created in ConceptDraw DIAGRAM diagramming and vector drawing software using the UML Class Diagram library of the Rapid UML Solution from the Software Development area of ConceptDraw Solution Park.
This sample shows the structure of the building and can be used by building companies, real estate agencies, at the buying / selling of the realty.
Picture: UML Class Diagram Example - Buildings and Rooms
Related Solution:
The popularity of visual content marketing grows day by day. So now simple and convenient designing of professional looking Content Marketing Infographics becomes increasingly actual. For achievement this goal ConceptDraw DIAGRAM software offers the Marketing Infographics Solution from the Business Infographics Area.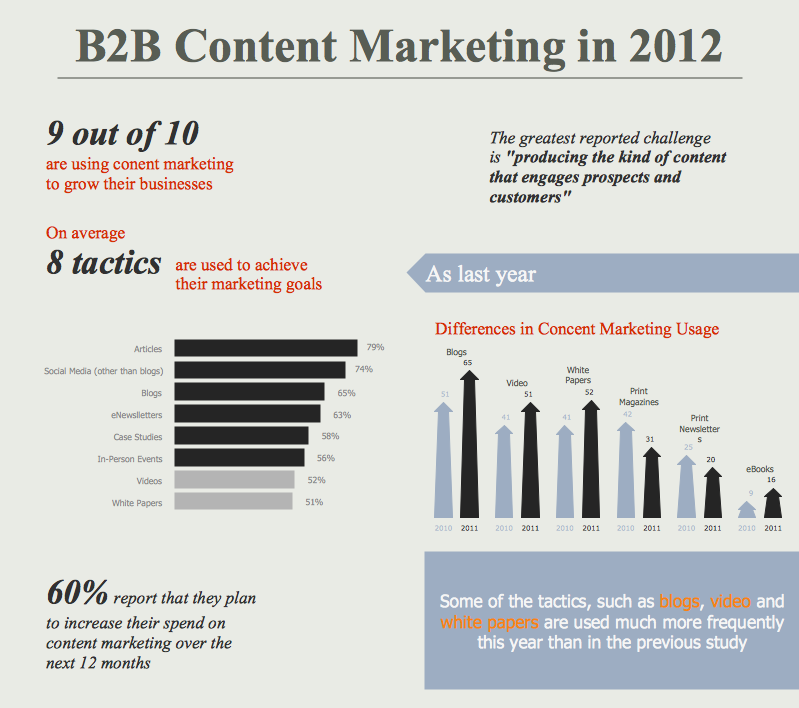
Picture: Content Marketing Infographics
Related Solution:
ER diagram is the most popular database design tool which lets create graphical representations of database tables, their columns and also relationships. As for the Mac users, they are very interested in powerful database diagramming tools and ER diagram tool for OS X to design professional looking E-R Diagrams and ERD drawings. ConceptDraw DIAGRAM software on Mac OS X gives the ability to easy draw ERDs.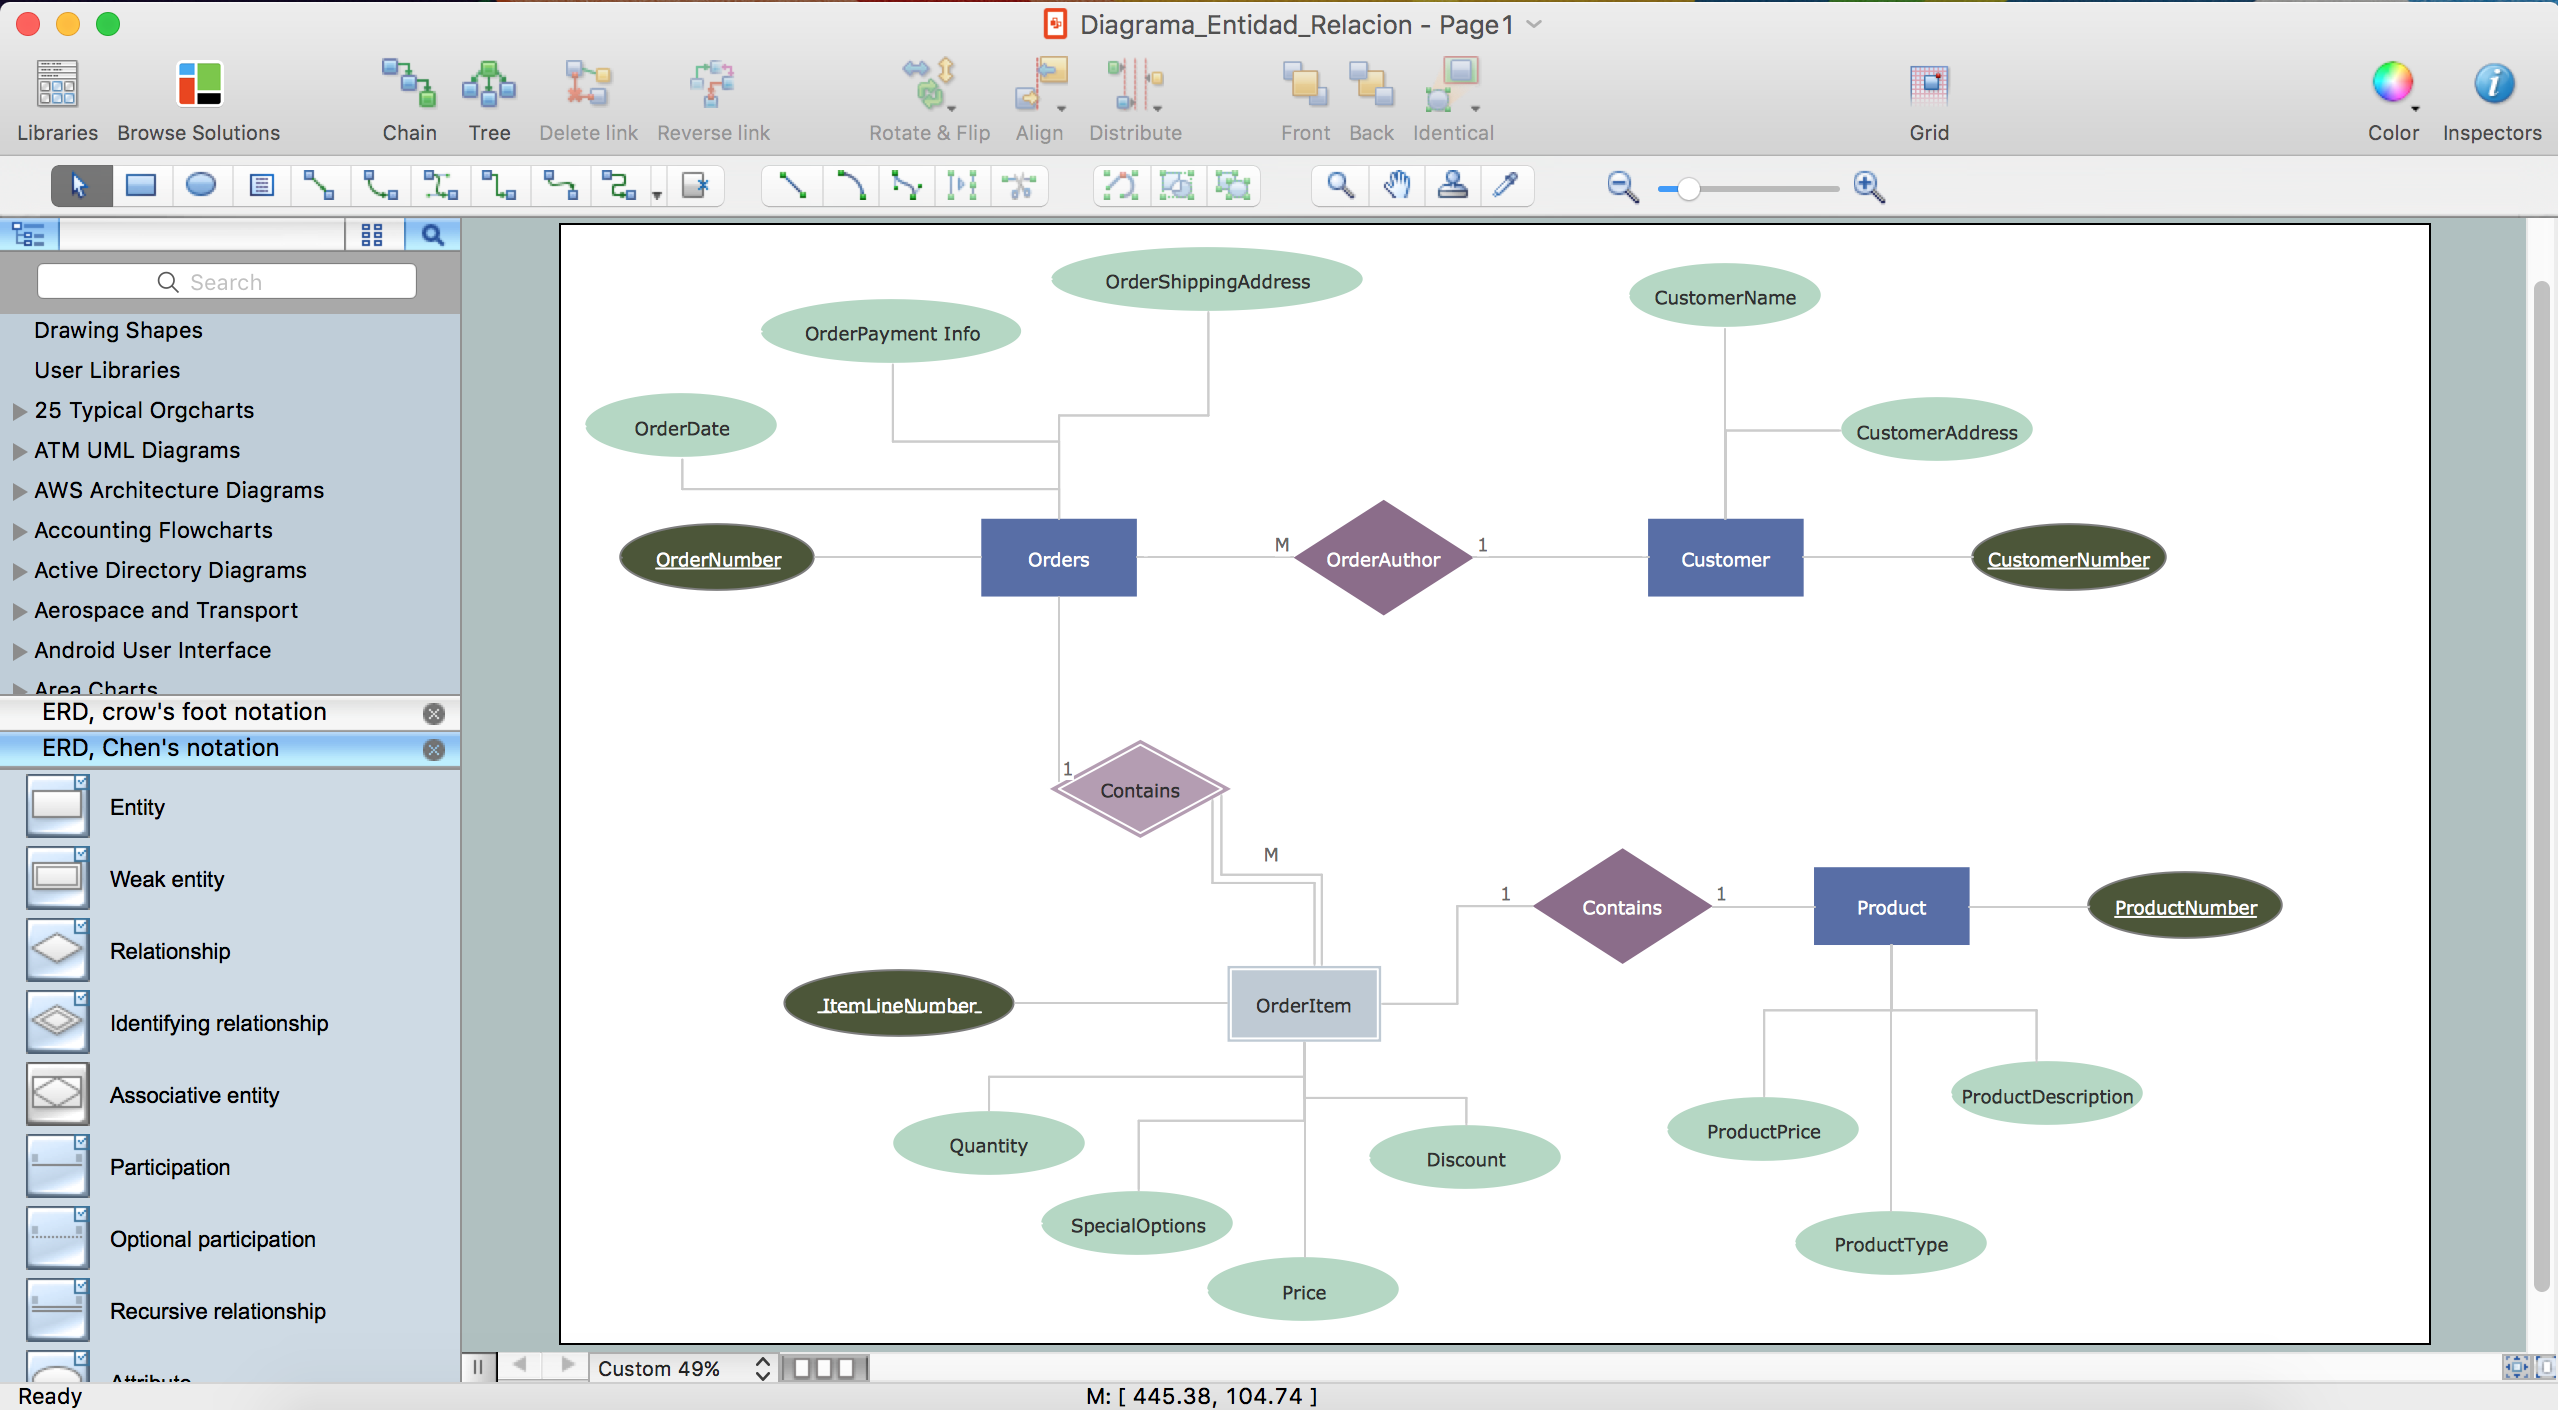
Picture: ER diagram tool for OS X
Related Solution:
Competitor analysis is a first and obligatory step in elaboration the proper corporate marketing strategy and creating sustainable competitive advantage. Use powerful opportunities of numerous solutions from ConceptDraw Solution Park for designing illustrative diagrams, charts, matrices which are necessary for effective competitor analysis.
Picture: Competitor Analysis
Related Solution:
The Education Infographics are popular and effectively applied in the educational process. Now you don't need to be an artist to design colorful pictorial education infographics thanks to the unique drawing tools of Education Infographics Solution for ConceptDraw DIAGRAM diagramming and vector drawing software.
Picture: Education Infographics
Related Solution:
ConceptDraw DIAGRAM diagramming and vector drawing software offers the Business Process Diagram Solution from the Business Processes Area of ConceptDraw Solution Park with powerful tools to help you easy represent the business processes and create the business process diagrams based on BPMN 2.0 standard.
Picture: BPMN 2.0
Related Solution:

