Diagramming Software for Design UML Timing Diagrams
UML Timing Diagram Designing
UML Timing Diagram as special form of a sequence diagram are used to explore the behaviors of objects throughout a given period of time. The differences from sequence diagram is the axes are reversed so that the time is increased from left to right and the lifelines are shown in separate compartments arranged vertically.
ConceptDraw helps you to start designing UML Diagrams with examples and templates.
You can use the appropriate stencils of UML notation from UML Timing library with
15 objects.
UML Timing Diagram Library
ConceptDraw Rapid UML solution delivers libraries contain pre-designed objects fit UML notation, and ready to draw professional UML Timing Diagram.

UML Timing Diagram Design Elements
Design elements sample shows all library objects at one page for quick review.

Design UML Timing Diagram in ConceptDraw DIAGRAM software
ConceptDraw DIAGRAM workspace is clear and simple. All tools you need for drawing UML Timing Diagram are on hand.


Examples of UML Timing Diagram
This is an example of UML Timing Diagram for an inspection process.

This example is created using ConceptDraw DIAGRAM diagramming and vector drawing software enhanced with Rapid UML solution from ConceptDraw Solution Park.

Rapid UML solution provides templates, examples and libraries of stencils for quick and easy drawing UML 2.4 timing diagram.
Use ConceptDraw DIAGRAM with UML Timing Diagram templates, samples and stencil library from Rapid UML solution to model how the objects of your system change their state or value over time, and how the timed events interact.

TEN RELATED HOW TO's:
A technical drawing of a building is called an architectural drawing. According to a set of conventions, a building drawing includes a number of views, as well as unit measurements, scales, sheet sizes, cross referencing and annotation. Computer progress had a major impact of the methods of architectural drawing, making manual drawing almost obsolete. Digital drawing software, such as ConceptDraw DIAGRAM , offers a number of tools for each design element: piping plan, floor plan, etc.
Any building should have its plumbing and piping plans for every room, that has a water supply. Plans are applied to indicate arrangement of piping system in the building. This diagram presents a suite of standard piping icons for making building plans that include plumbing and piping layout. This diagram was designed using ConceptDraw solution for Piping and Plumbing planning. Using symbols is valuable for making a valid piping plan. Because any professional will properly interpreted such plan as a piece of technical documentation of a construction project.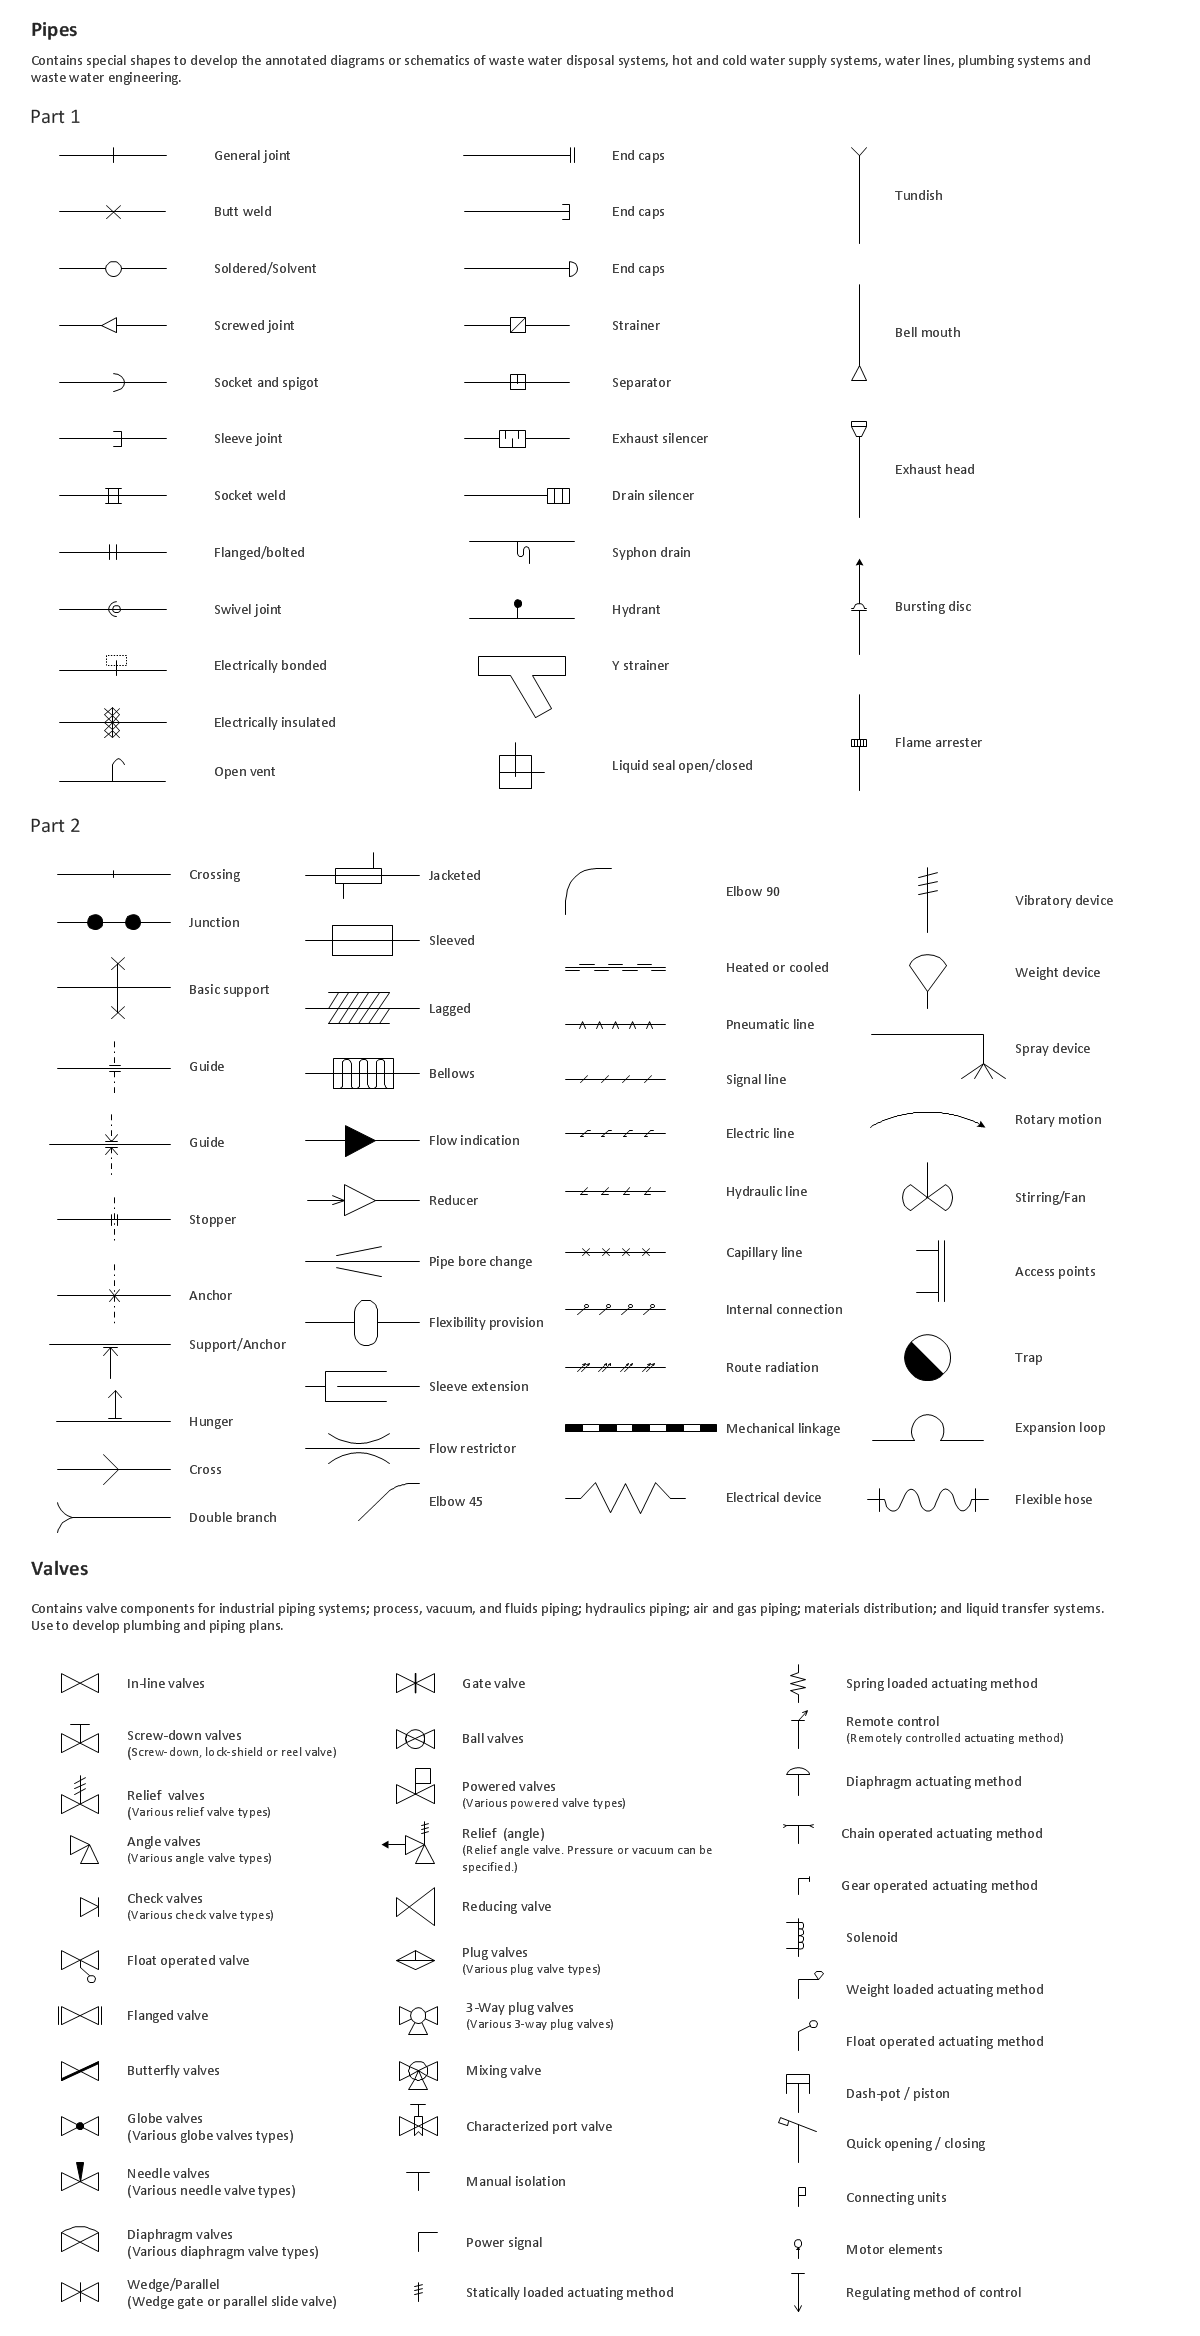
Picture: Building Drawing. Design Element: Piping Plan
Related Solution:
Database design is an important part of any project, as databases become more and more complex nowadays. To make the model more representative, entity relationship diagrams are widely used in software engineering area. These diagrams show sets of entities as rectangles connected via lines labeled with their cardinalities.
This an example of the ER-diagram developed to store information regarding some online role-playing game. It includes three main elements of ER diagram: entities, relationships and attributes. The entities, attributes and relationships on this ER-diagram is depicted according to the Chen's notation. Chen's notation for Entity Relationship diagrams admits using of rectangles to depict entities, ovals for attributes and ,at least, diamonds to show relationships. ConceptDraw Entity-Relationship Diagrams solution was applied as ERD software to create this diagram.
Picture: ConceptDraw DIAGRAM ER Diagram Tool
Related Solution:
Functional modeling allows to make complex business processes simple. One of the basic methods is IDEF0 and one of the most effective also. To create a business model, use flowchart symbols.
The IDEF0 library, supplied with ConceptDraw IDEF0 Diagrams solution contains 18 IDEF0 basic notation symbols. All symbols are the vector graphic images what means, that one can customize their size preserving the stable quality. Another library of IDEF0 symbols can be find out in the the Business Process Diagrams solution, included to the Business Processes section of ConceptDraw Solution Park. These libraries composed from just vector objects and are totally compatible. You can apply the IDEF0 symbols from both libraries at your flowcharts, if needed.
Picture: IDEF0 Flowchart Symbols
Related Solution:
There are a lot of tutorials that get you familiar with emergency situations. If you want to know how to create emergency plans and fire evacuation schemes then you must be concerned about safety. There is a list of rules that you should follow to set the fire safety equipment properly.
Discover this precise and accurate fire emergency evacuation plan. This sample drawing demonstrate facilities of ConceptDraw DIAGRAM together with its Fire and Emergency Plans solution. The evacuation plan is designed to provide employees and visitors with a map depicting the ways they may use to escape the building in emergency situations. The telephone sets, first aid boxes and extinguisher are also marked on this plan. The evacuation plan should contain a legend for readers. The similar plans are commonly hang on the wall on the building's floors.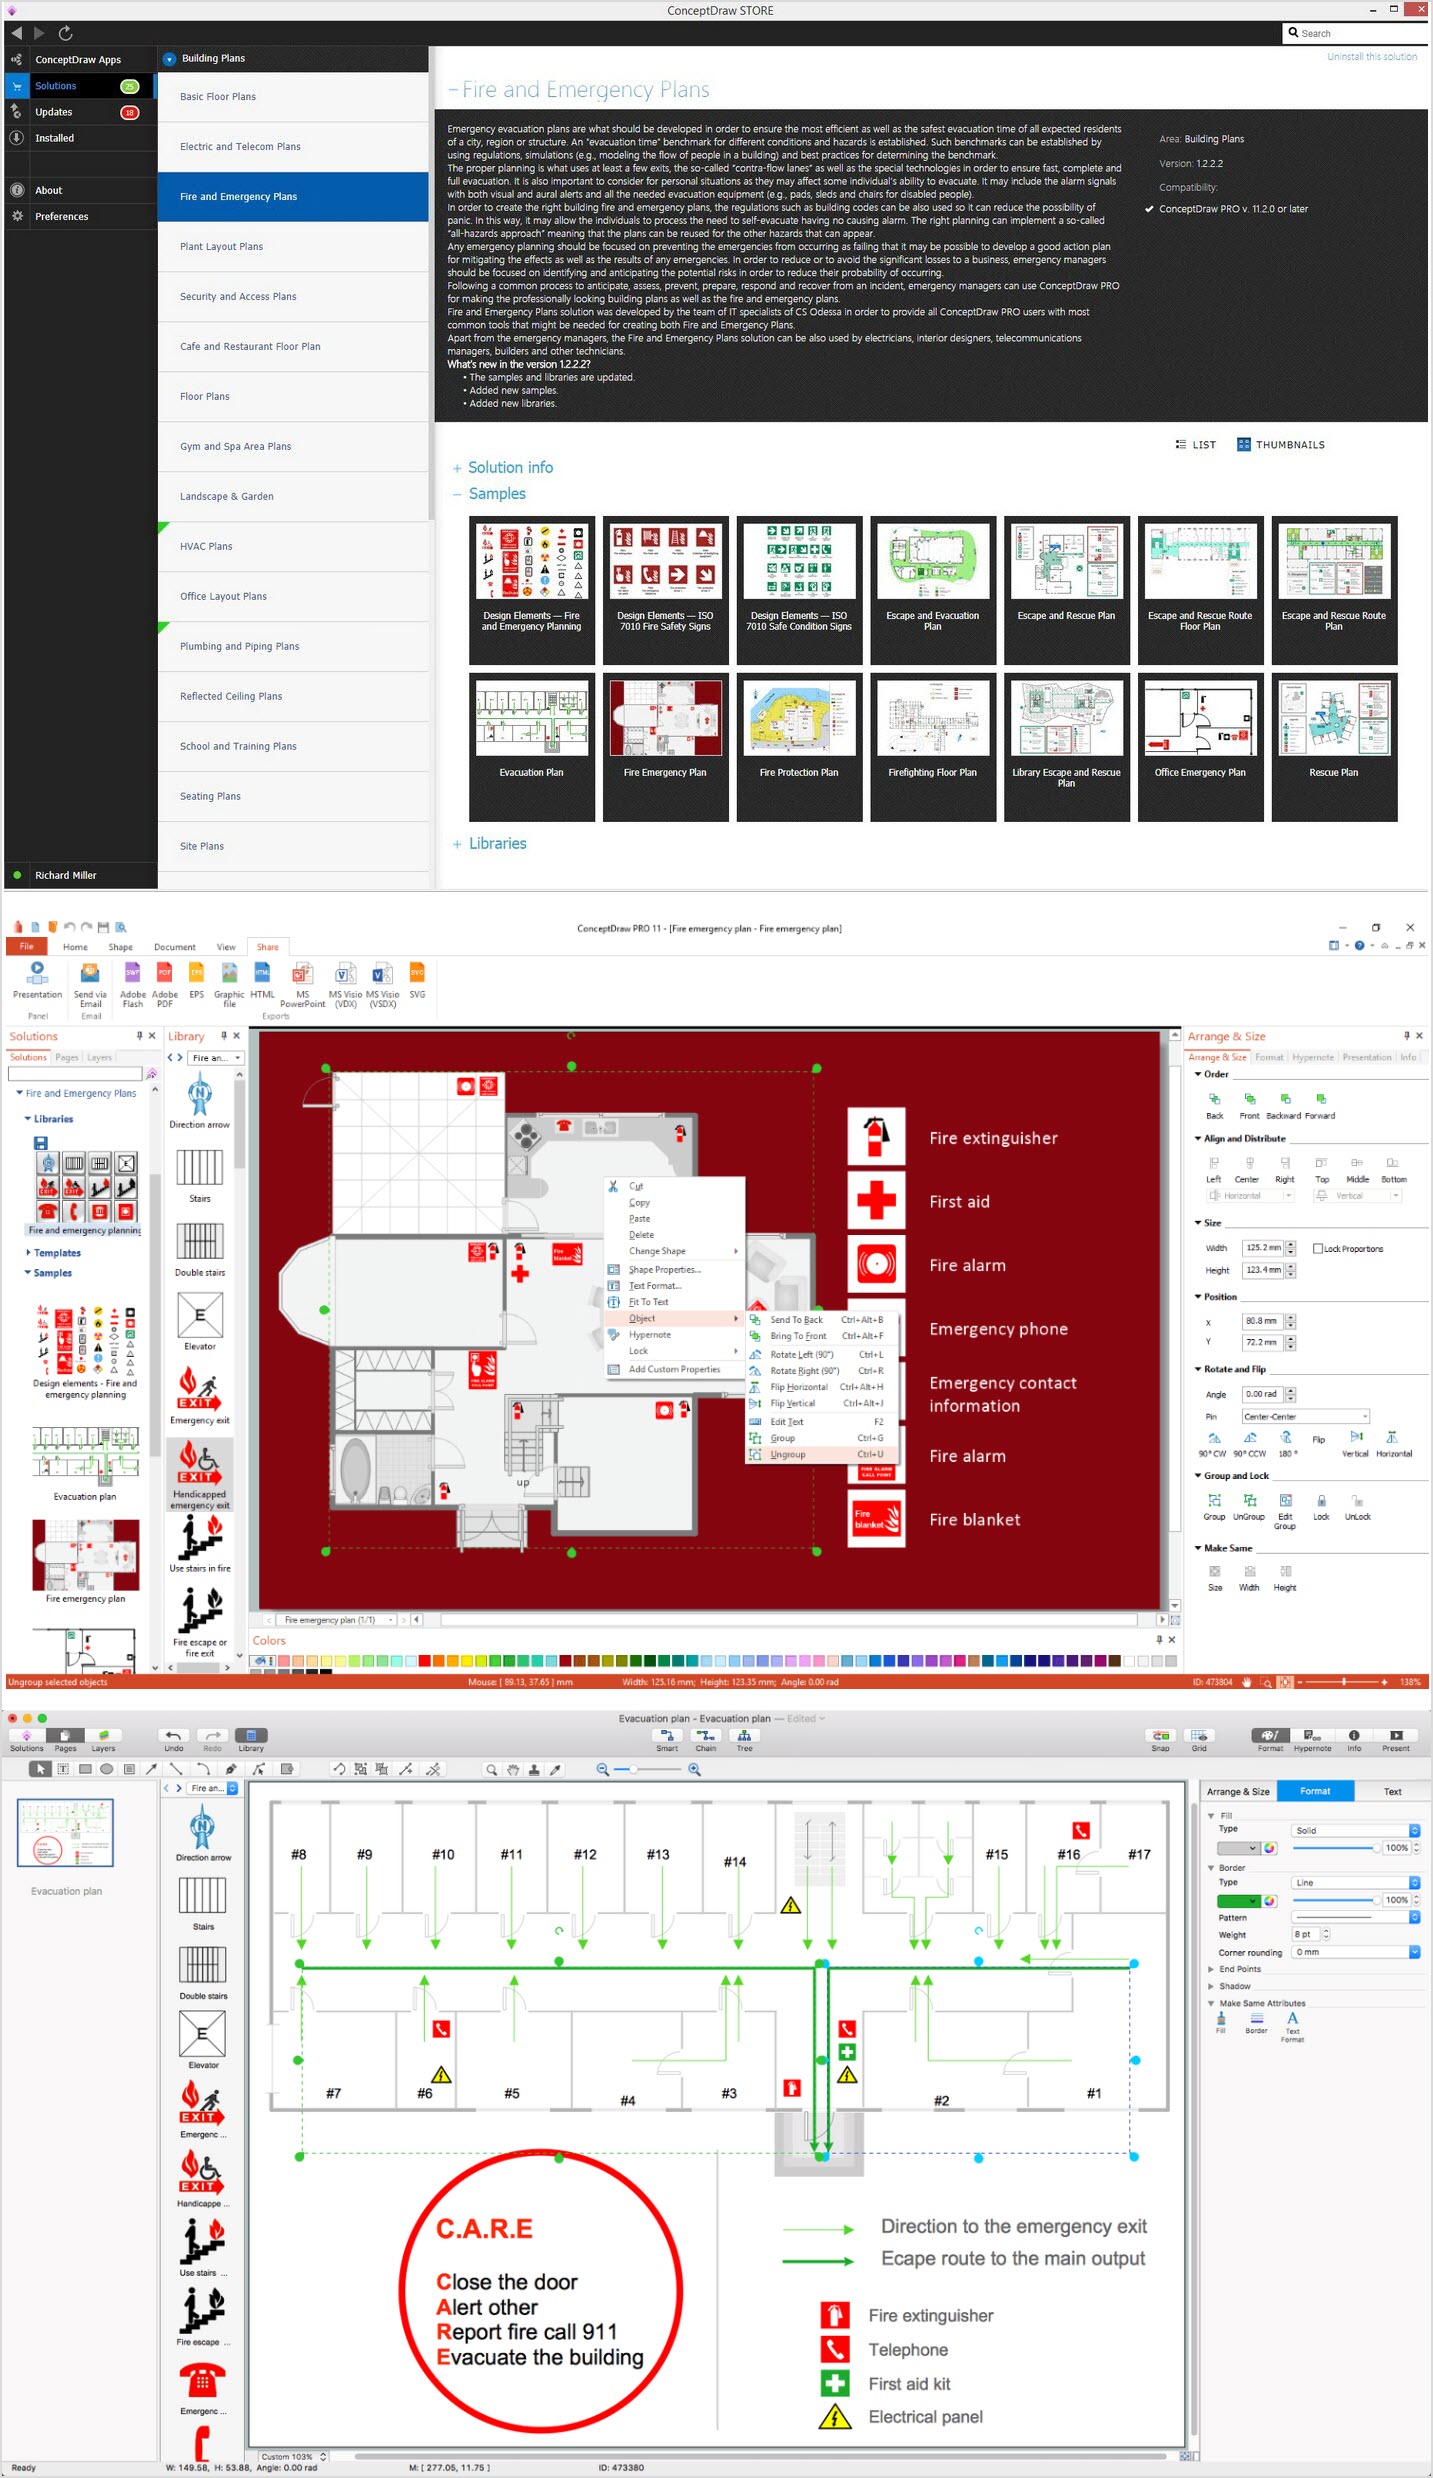
Picture: How To Create Emergency Plans and Fire Evacuation
Related Solution:
While designing a conceptual data model, you should use appropriate software. For instance, ConceptDraw DIAGRAM is a user-friendly ER diagram tool that has a lot of samples and templates to facilitate your work. A clear entity-relationship diagram helps to define the relations between system’s components.
Software engineering is the section of a computer science engaged to design, realization, and support of complex software products. An ERD is a data modeling method that is widely applied in the software engineering practice. Commonly it is used for developing a structure of a a relational database. An entity relationship diagram is helpful for structuring and organizing databases that can be modeled using a relational structure. An entity relationship diagram is designed to depicts the interrelationships within the sets of entities which are accumulated in the database. Each entity represents a particular component of a data. Thus, ER diagrams depicts the logical structure of databases. ConceptDraw ER Diagrams solution provides software engineers with the professional tool for making entity-relationship diagrams.
Picture: Entity Relationship Diagram Software Engineering
Related Solution:
Times when you had difficulties in searching for an appropriate software depending on your OS, had passed. If you still look for a great software to create flowcharts on Mac, here is the answer. ConceptDraw Pro is a great tool for creating diagrams, with tons of samples, libraries and tutorials.
Making flowchart diagram is the best way to represent a process as a sequence of steps. Flowcharting provides a simple way of organizing and representing data so that even complex and detailed processes become clear. That is why using a flowchart software tool is proven to be an ideal for structure and share an information on process workflow structure. This flow chart was created to depict the steps of certification process. This flow chart was created using ConceptDraw DIAGRAM software for Apple OS X. The Rapid Draw technology was used to create this flow chart. ConceptDraw DIAGRAM also supports popular Apple OS X features such as Quick Look, Full-Screen Mode, Version Browsing and Autosave. You can export your multi-page diagrams to SVG or graphic formats such as TIFF, JPEG, PNG and PDF.
Picture: Create Flow Chart on Mac
Related Solution:
Looking for the line graph examples you can simply go to the Line Graphs solution of ConceptDraw STORE to get those which were previously created especially for the ConceptDraw DIAGRAM users in order to simplify their work of making such charts.
Picture: Line Graph
Related Solution:
To maintain big and complex mechanical systems, you need an appropriate education and tools. It’s needless to say that mechanical drawing is important part of any industrial project. There are a lot of standard symbols depicting valves, pumps, motors, etc.
This drawing illustrates the content of the Fluid Power Equipment library provided by the ConceptDraw Mechanical Engineering solution. The solution is composed from the 8 libraries, containing about 500 elements related to mechanical engineering visualization. it will be helpful for drawing various schemes, charts and blueprints of pneumatic, and hydraulic equipment or other drawing related mechanical engineering. All drawings can be freely resized without loss of quality due to the vector graphics components of its facilities.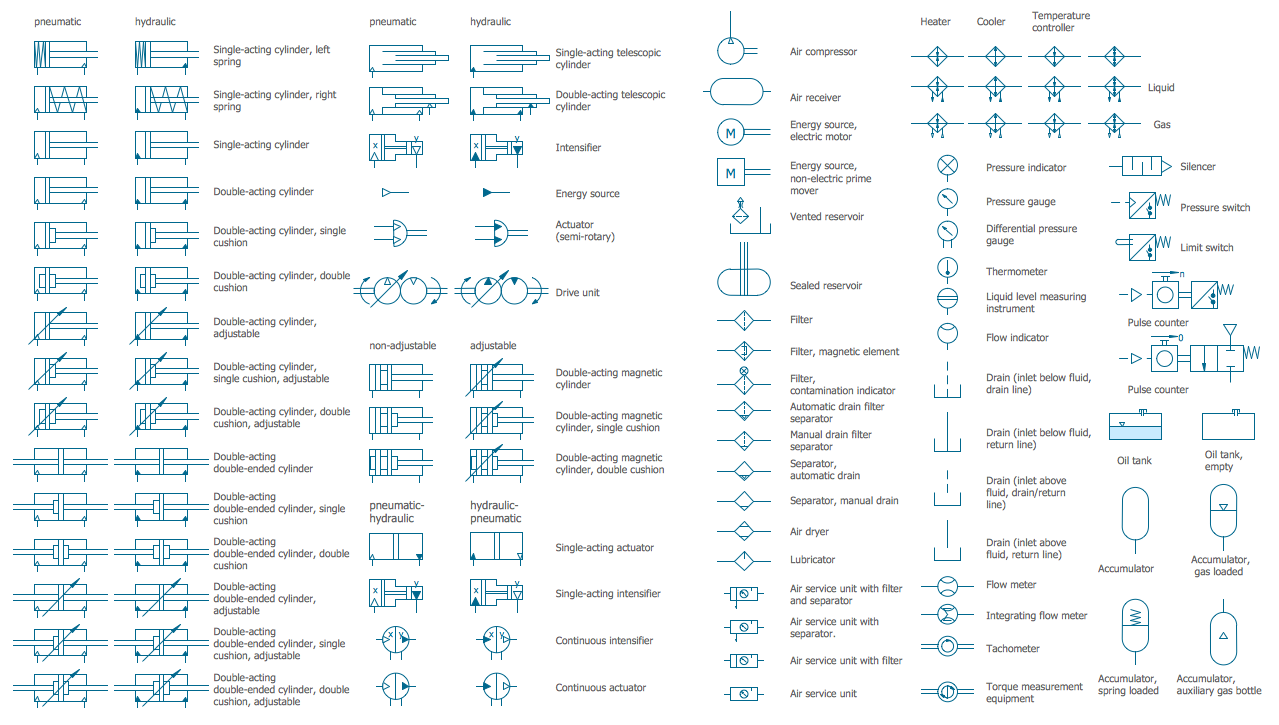
Picture: Mechanical Drawing Symbols
Related Solution:


