
Example 1. Histogram - Age of Presidential Acsension
Use of special software such as ConceptDraw DIAGRAM is the easiest way of drawing a Histogram. Seven Basic Tools of Quality Solution provides 9 libraries with variety of predesigned vector objects, among them is a Histogram library which contains ready-to-use histogram objects.
Now, to design a Histogram, you need only choose the appropriate object from the Histogram library and simply fill it with your own data.

Example 2. Histogram Library Design Elements
Another way is to use as the basis one of the samples offered by the Seven Basic Tools of Quality Solution in ConceptDraw STORE.

Example 3. Seven Basic Tools of Quality Solution in ConceptDraw STORE
Each sample included in Seven Basic Tools of Quality solution for ConceptDraw DIAGRAM is carefully thought-out example, perfect base for drawing your own chart, diagram or histogram and excellent source of inspiration!

Example 4. Histogram - Frequency Allocation Diagram
The samples you see on this page were created in ConceptDraw DIAGRAM software using the Seven Basic Tools of Quality Solution and demonstrate the Histograms. These examples successfully demonstrate solution's capabilities and professional results you can achieve. An experienced user spent 10-15 minutes creating each of them.
Use the Seven Basic Tools of Quality Solution for ConceptDraw DIAGRAM software to create your own professional looking Histogram of any complexity quick, easy and effective.
All source documents are vector graphic documents. They are available for reviewing, modifying, or converting to a variety of formats (PDF file, MS PowerPoint, MS Visio, and many other graphic formats) from the ConceptDraw STORE. The Seven Basic Tools of Quality Solution is available for all ConceptDraw DIAGRAM
NINE RELATED HOW TO's:
These vector illustrations and cliparts are created for drawing the Project management Illustrations and contain plenty of project management design elements. The clipart library Project management includes 35 icons.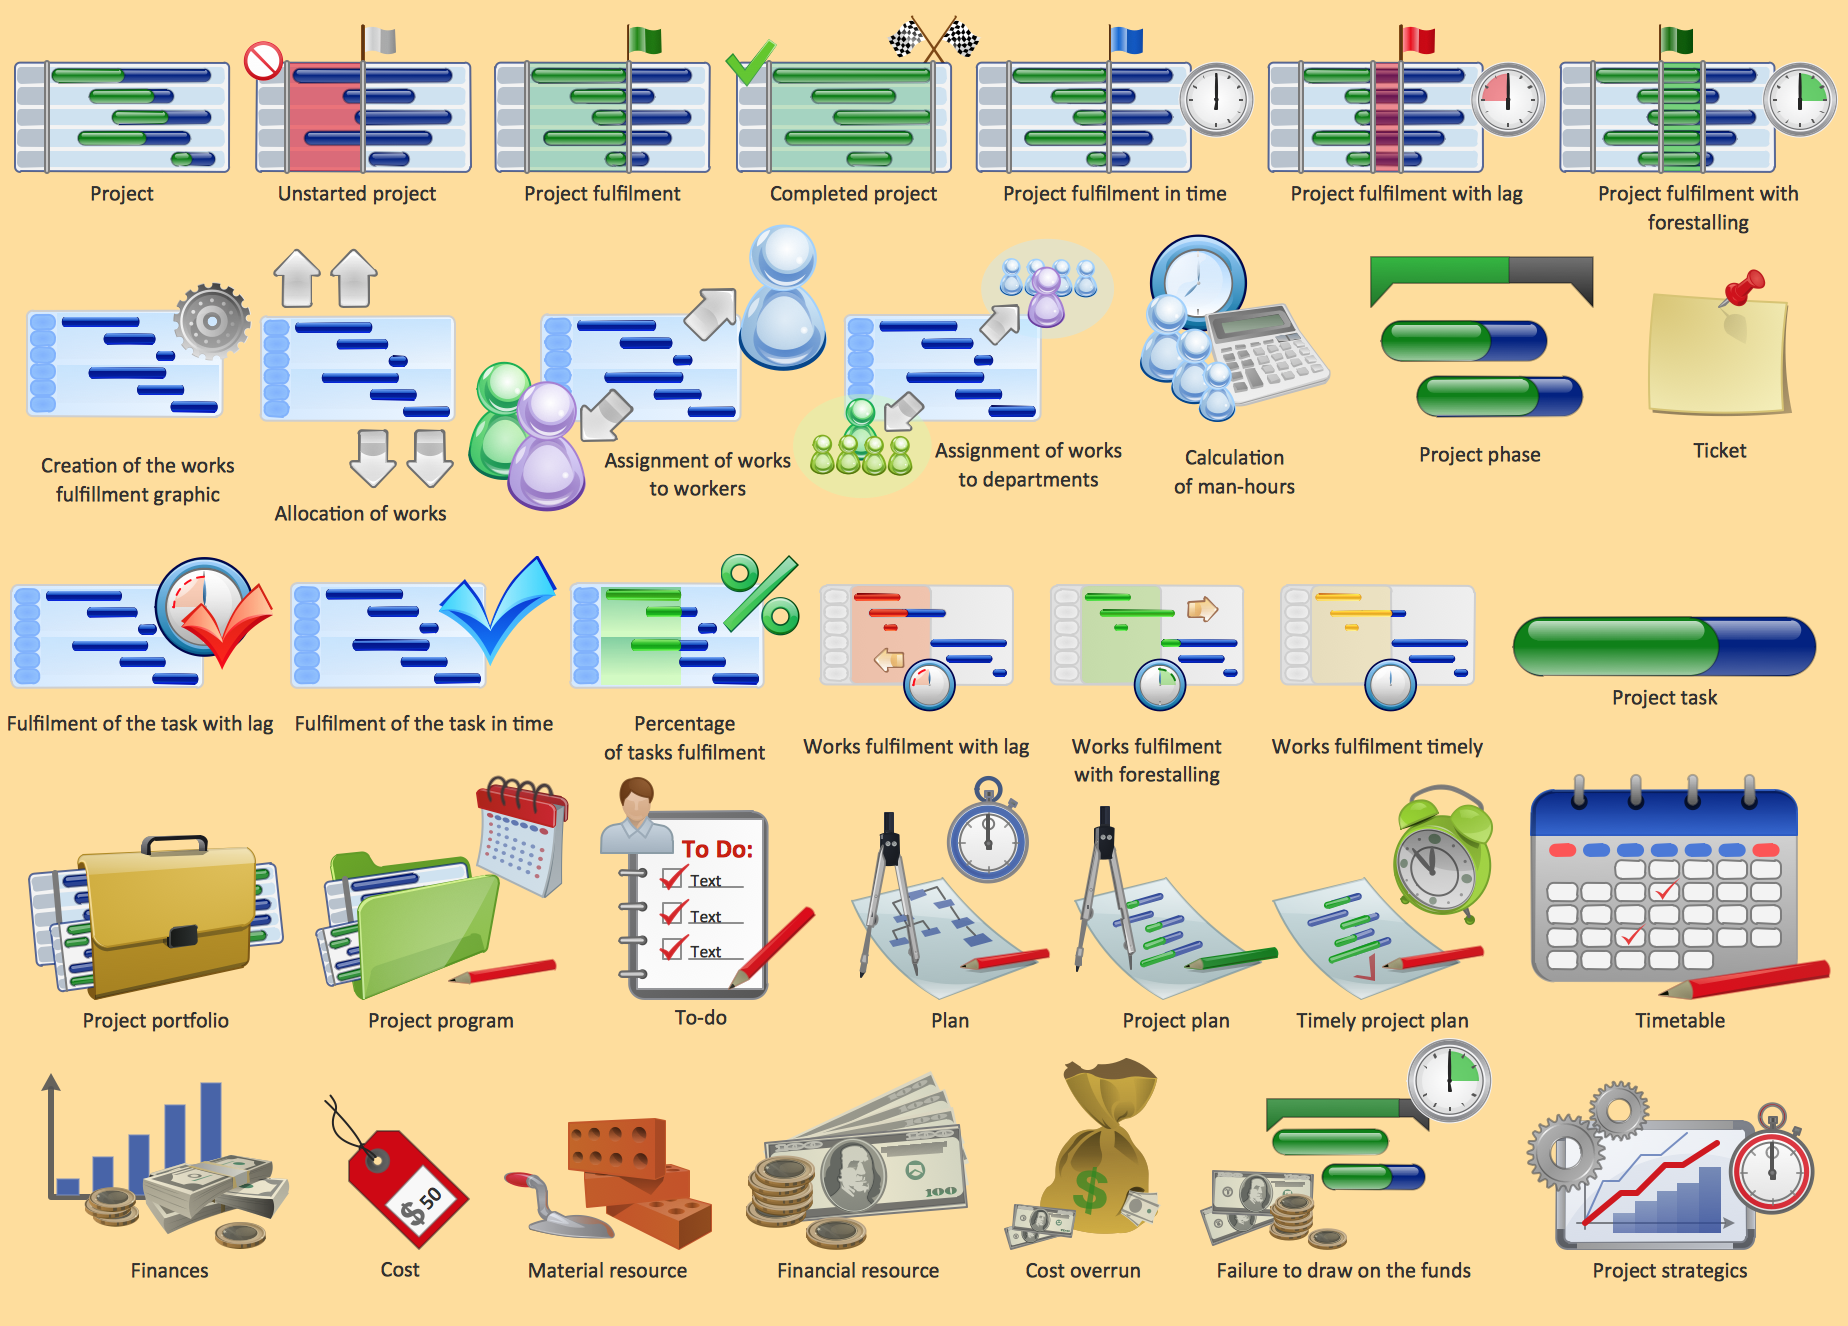
Picture: Project management - Design Elements
Related Solution:
Wireless Networks solution from ConceptDraw Solution Park extends ConceptDraw DIAGRAM diagramming and vector drawing software to help network engineers and designers efficiently design, create and illustrate WAN network diagram of any complexity. The ConceptDraw DIAGRAM software helps users to quickly transit from an idea to the implementation of a Wireless Network WAN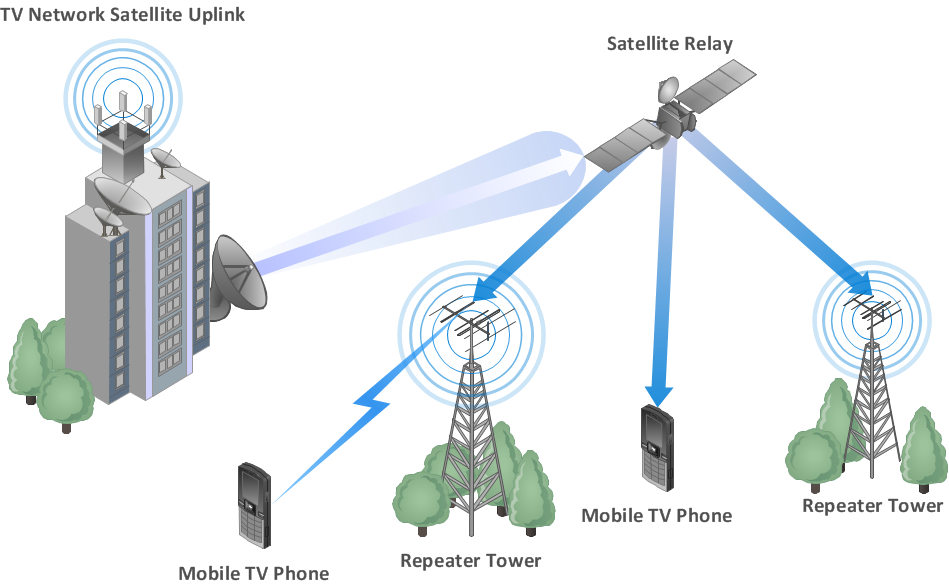
Picture: Wireless Network WAN
Related Solution:
Acquaintance with flowcharting starts from getting into basic terms. First of all, flowchart definition is quite clear – a flowchart is a graphical representation of a process or an algorithm made of special symbols. Secondly, flowcharting is an irreplaceable tool for IT specialists, project managers, and anyone who wants a clear understanding of any imaginable process.
Picture: Flowchart Definition: A Complete Guide
Related Solution:
The Ring Network Topology Diagram examples was created using ConceptDraw DIAGRAM software with Computer and Networks solution.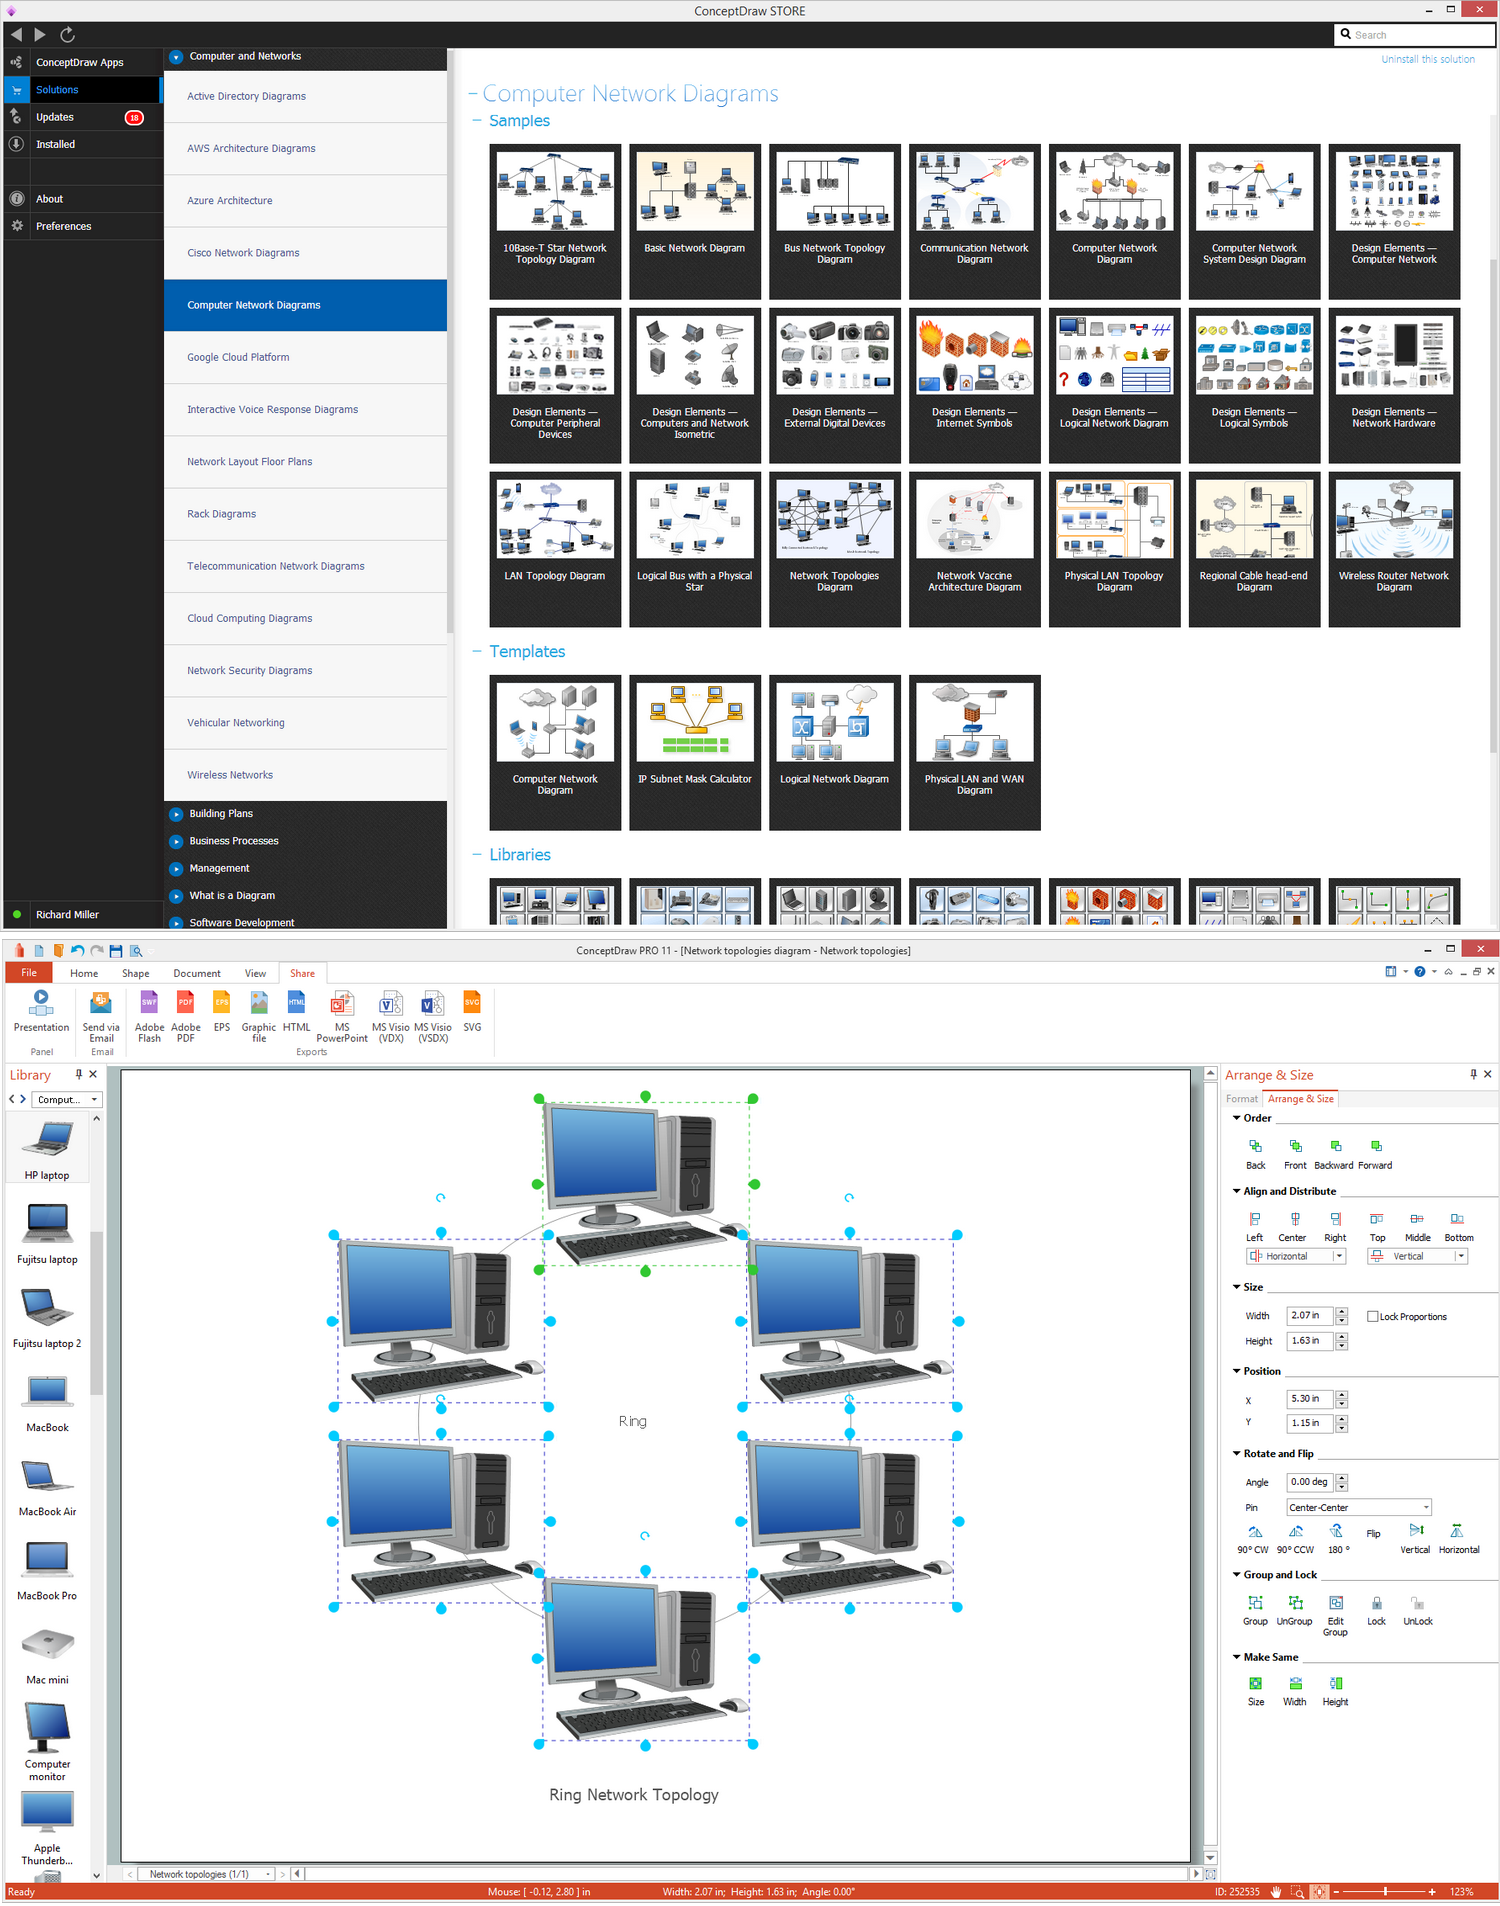
Picture: Ring Network Topology
Related Solution:
UML state machine's goal is to overcome the main limitations of traditional finite-state machines while retaining their main benefits.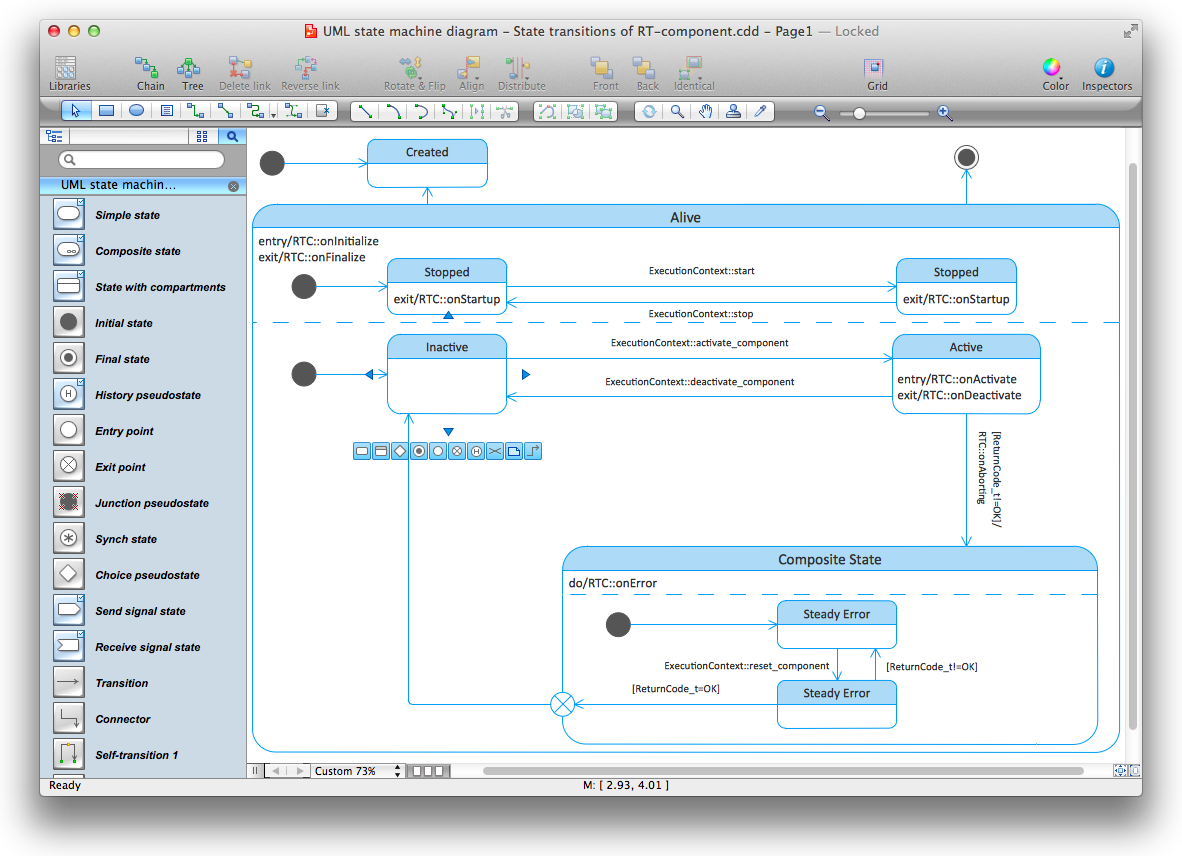
Picture: Diagramming Software for Design UML State Machine Diagrams
Templates are very useful and convenient tool for fast and easy drawing various diagrams, charts, and also flowcharts.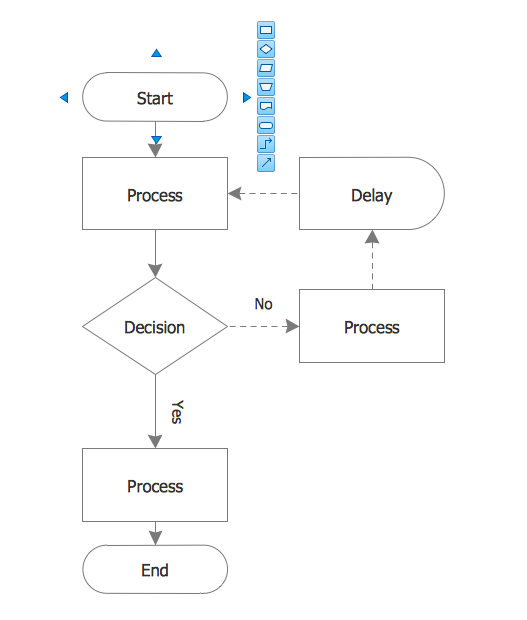
Picture: Flow Chart Template
Related Solution:
When thinking about data visualization, one of the first tools that comes to mind is a flowchart design. You can find flowchart symbols, shapes, stencils and icons easily on the Internet, but it might take time to systematize this information. Nevertheless, once you start flowcharting, you’ll love its simplicity and efficiency.
This diagram consists from standard flowchart symbols, approved by ANSI (American National Standard Institute) for drawing flowcharts. A flowchart is a diagram that represents a step-by-step algorithm of any process, displaying the process stages as boxes that are connected with arrows. Flowchart design makes it clear and readable.
Flowchart designed using ConceptDraw DIAGRAM flowchart software allows to make attractive and clear process presentation, it makes interpretation of the business process flow fresh and versatile. Great flowchart design view is a big advantage over the diagram created manually on a paper.
Picture: Flowchart Design: Principles, Layout, Symbols and Best Practices
Related Solution:
Critical information from your mindmaps can be accessed from almost any device using ConceptDraw MINDMAP and Evernote.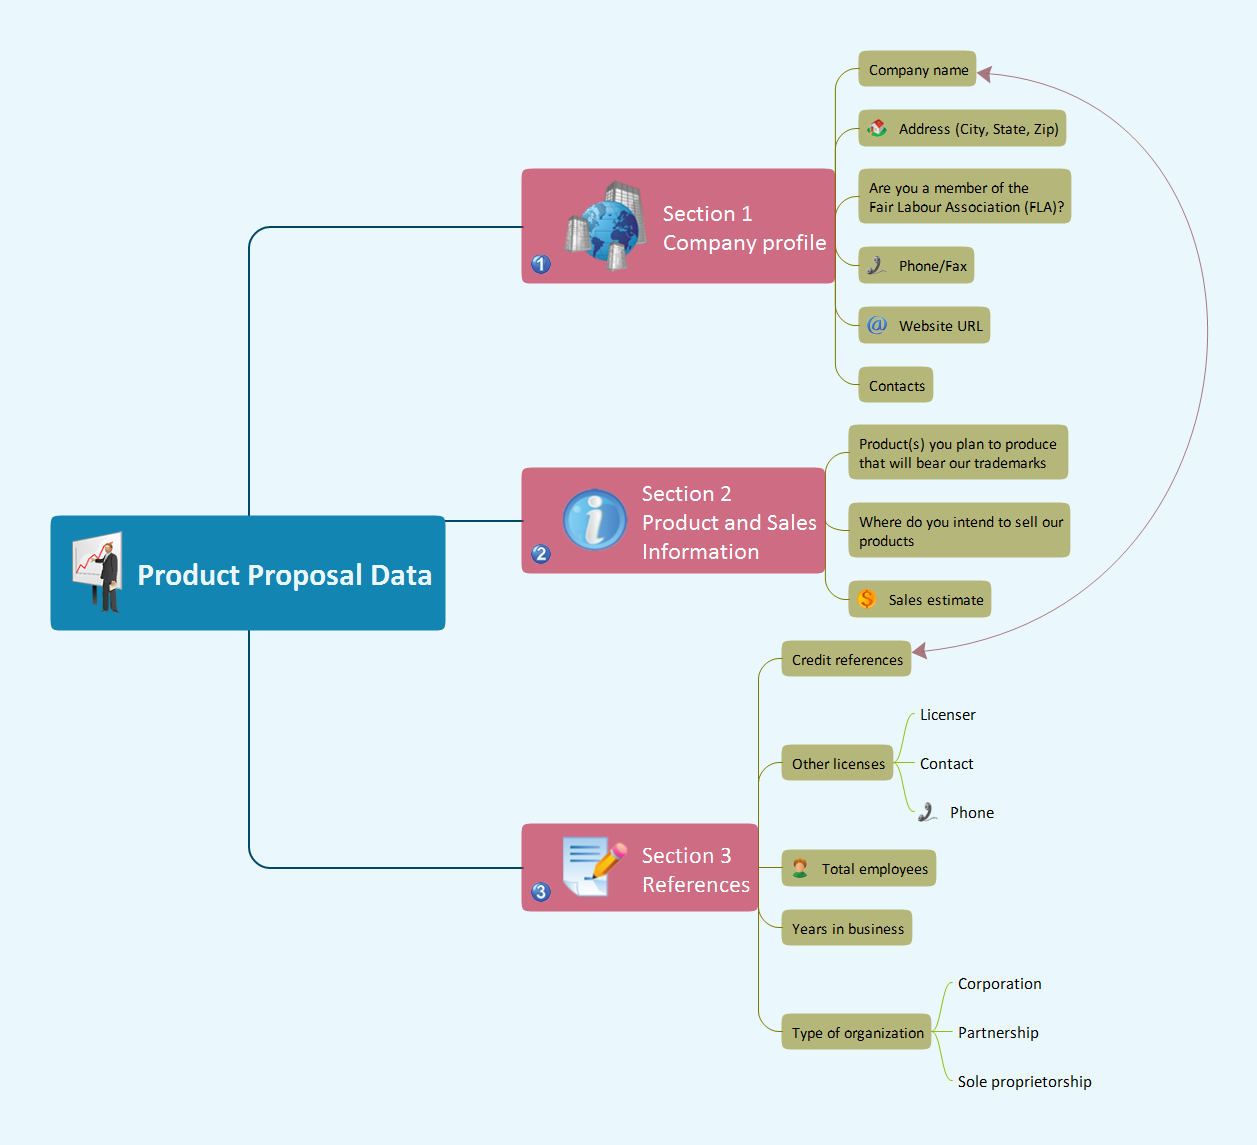
Picture: Gather Requirements Exchanging Mind Maps with Evernote
Related Solution:
Electrical plan is a document that is developed during the first stage of the building design. This scheme is composed of conventional images or symbols of components that operate by means of electric energy. To simplify the creation of these schemes you can use house electrical plan software, which will not require a long additional training to understand how to use it. You only need to install the necessary software ant it’s libraries and you’ll have one less problem during the building projection.
Any building contains a number of electrical systems, including switches, fixtures, outlets and other lightening equipment. All these should be depicted in a building electrical plans and included to general building documentation. This home electrical plan displays electrical and telecommunication devices placed to a home floor plan. On the plan, each electrical device is referenced with the proper symbol. Electrical symbols are used for universal recognition of the building plan by different persons who will be working on the construction. Not all possible electric symbols used on a certain plan, so the symbols used in the current home plan are included to a legend. The electrical home plan may be added as a separate document to a complete set of building plans.
Picture: How To use House Electrical Plan Software
Related Solution:


